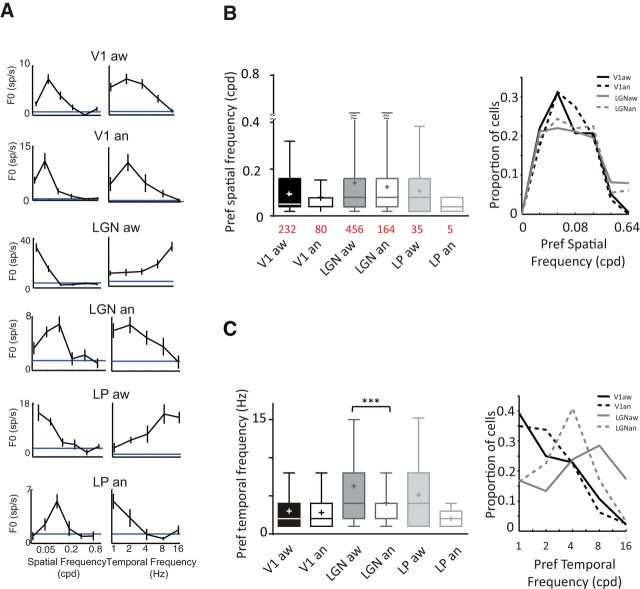
Figure 5.
Spatial and temporal preferences. A, Representative examples of spatial and temporal frequency (SF and TF) tunings for the same cells seen in Figure 4A. B, Left, Box plots represent medians as a bar, mean as a cross, and illustrate 5th and 95th percentiles. Mean peak SF across layers is not significantly affected by state (Kruskal–Wallis test, not significant), (right) proportion of cells responding optimally to SF tested. C, Left, Mean peak TF is decreased in anesthetized dLGN (mean: 6.27 ± 0.22 vs 4.07 ± 0.23 Hz; Mann–Whitney test, p < 0.0001). Right, proportion of cells responding optimally to TF tested. *, p < 0.05; **, p < 0.01; ***, p < 0.001.

