
Figure 8.
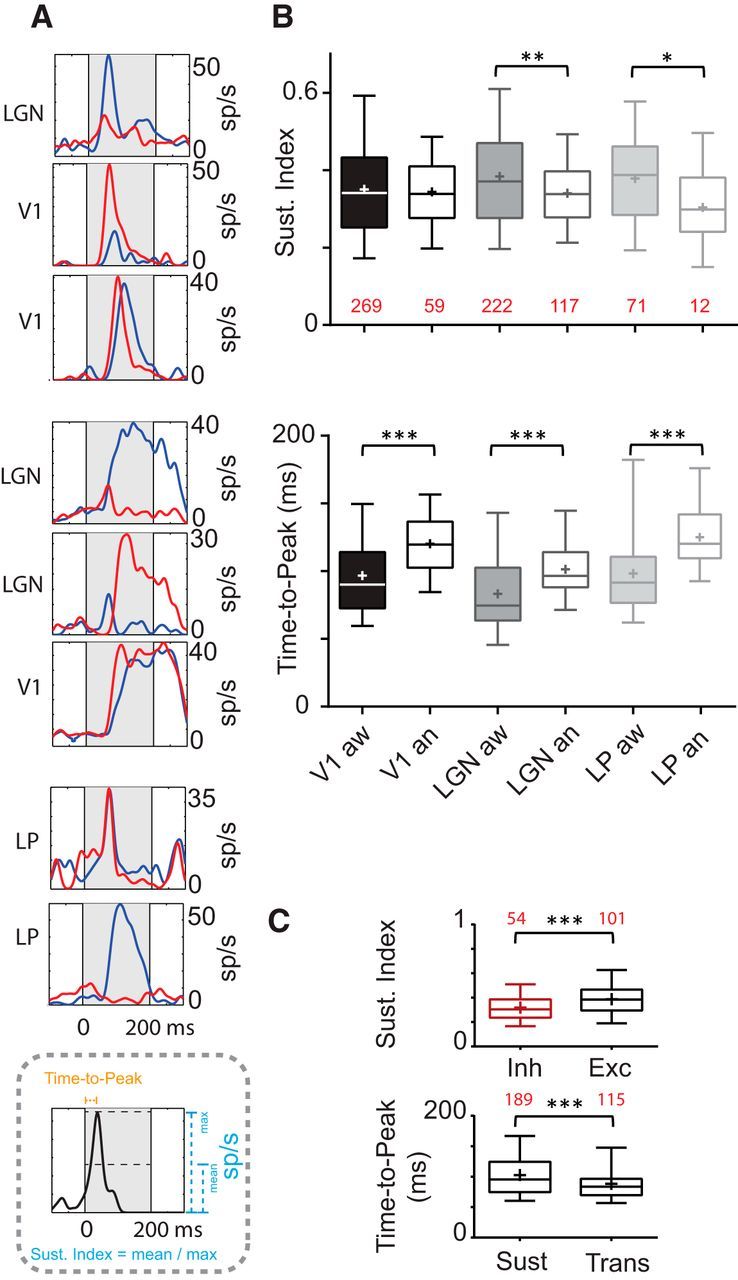
RF temporal characteristics. A, PSTHs are shown and illustrate the diversity of response time course (transient or sustained) of ON (red) and OFF (blue) responses corresponding to V1, dLGN, and LP cells seen in Figure 7A (in a different order). Bottom panel, Schematic representation of how the time to peak and sustained index were measured. B, Box plots represent medians as a bar, mean as a cross, and illustrate 5th and 95th percentiles. Mean of sustained index and time to peak values for each area and state. The sustained index is calculated as the ratio between the length of the response and that of the stimulus. Sustainedness is sensitive to state in dLGN (Mann–Whitney test, p = 0.005) and LP (Mann–Whitney test, p = 0.037). Time to peak is calculated from the PSTH as the time for the response to reach its maximum. Time to peak is extremely sensitive to anesthesia and is longer compared with responses in awake state for all areas. The number of subunits is in red. C, Top, Inhibitory cell sustained index is lower than excitatory neurons in the cortex (0.317 ± 0.018 vs 0.390 ± 0.01; Mann–Whitney test, p = 0.0009). Bottom, Cells with a sustained index >0.3 were classified as sustained, others as transient. The mean of time to peak for sustained (109.1 ± 2.9) and transient cells (90.2 ± 3.1, Mann–Whitney test, p < 0.0001). The number of subunits is in red. Putative excitatory and inhibitory cells are grouped together when not explicitly separated into two groups. *, p < 0.05; **, p < 0.01; ***, p < 0.001.