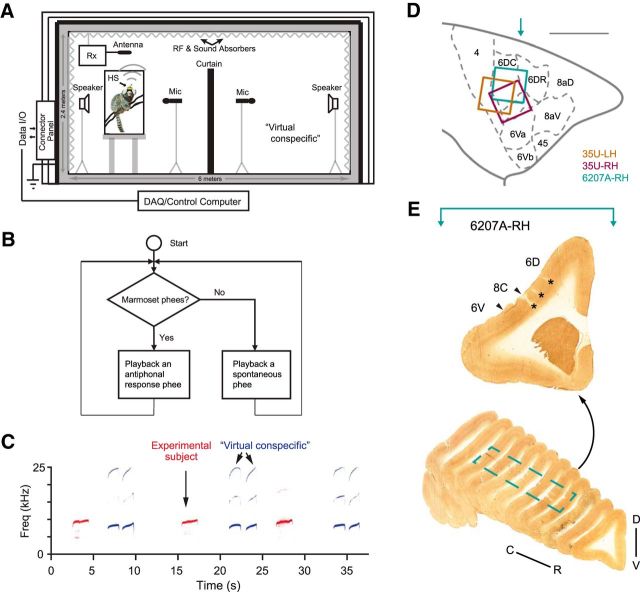
Figure 1.
Illustrations of the experimental setup and examples of recorded marmoset vocalizations. A, Schematic illustration of the recording chamber with acoustic and wireless neural recording systems. HS, Wireless head stage; Rx, receiver. The custom-built chamber was designed to isolate electromagnetic wave transmission and reflection, attenuate external sounds, and reduce internal sound reflection (Roy and Wang, 2012). In the vocal production condition, an experimental subject was placed in a plastic cage shown on the left side of the chamber. A wireless headstage (HS) was mounted on top of the subject's head and connected to an electrode array in the premotor cortex. A receiver (Rx) for the wireless system was placed above the cage. The subject's vocalizations were recorded by a microphone in front of the cage. During antiphonal calling behavior, a virtual conspecific was configured on the right side of the chamber. It replaced a real marmoset by a computer-controlled playback system and engaged the experimental subject in vocal exchanges (Miller et al., 2009). B, Computer algorithm controlling the virtual conspecific (Miller and Wang 2006; Miller et al., 2009). Once a phee call from the experimental subject was detected, a prerecorded phee of another marmoset in our colony was presented by the playback system with a delay (1–5 s, according to the statistics of antiphonal calling delays between pairs of marmosets). If there was no response from the experimental subject, another prerecorded phee was presented after a second delay (up to 60 s, according to the statistics of the time intervals between spontaneously produced phee calls). C, Spectrogram showing a series of antiphonal phee exchanges. In this example, the experimental subject made single-phrase phee calls and the virtual conspecific delivered two-phrase phee calls. D, Estimated electrode coverage areas for the three hemispheres (with Brodmann's areas marked accordingly). The area between 6DC and 6Va is 8C. The colored square is aligned with the outermost electrodes of the array. Locations of electrode arrays are estimated based on histology (6207A) and geometric measurements on the skull surface during implantation (with respect to the lateral sulcus) with a comparison with the marmoset brain atlas (Paxinos et al., 2012). Scale bar, 5 mm. The turquoise arrow indicates the approximate location of the example section in E. LH, left hemisphere; RH, Right hemisphere. E, Coronal sections from 6207A right hemisphere with cytochrome oxidase stain. Top, Example section marked with cortical regions (border indicated with arrowheads) and electrode locations (asterisks). The approximate location of the section with respect to the brain on the rostral–caudal axis is indicated by a turquoise arrow in D. Bottom, Series of sections from the frontal brain of 6207A with the border of the electrode coverage area marked (dashed line). D–V, Dorsal–ventral; C–R, caudal–rostral.

