
Figure 2.
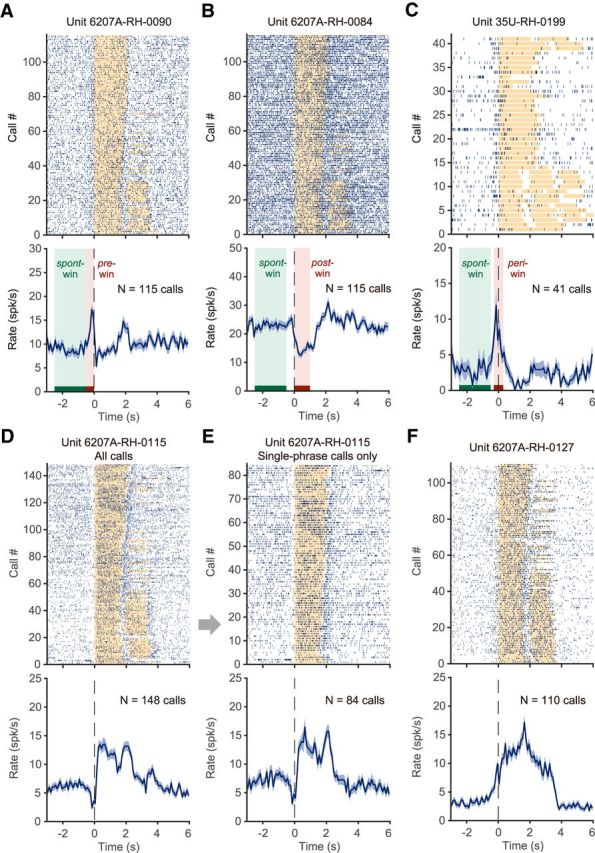
Neural activity in the vocal production condition: examples of individual neurons for individual recording sessions. A, Neuron showing increased activity before vocal onset. Top, Each vertical line indicates a spike. Spike timing is aligned to the vocal onset. Orange bars indicate the duration of phee call phrases. Some of the calls had two phrases, which are shown as two bars in a row. In general, subjects tended to make multiphrase phee calls at the beginning of an experimental session and were more likely to produce single-phrase phee calls toward the end. Bottom, Firing rate shown as mean ± SEM. N indicates the number of calls. B, Neuron showing decreased activity during vocal production. This neuron was recorded in the same vocal production session as the neuron in A. C, Neuron showing increased activity near the vocal onset time. Three analysis windows are used to capture neuronal activities as in these examples: pre-, post-, and peri- windows, indicated by a red bar and a pink-shaded area (A–C). The spont-window used in analysis is indicated by a green bar and shaded area (A–C). D, Neuron showing decreased activity before vocal onset and increased activity during vocal production. E, Same neuron in D, with only single-phrase phee calls included. A clear activation is also seen after the end of the vocal production. F, Neuron showing strong activation both before and during vocal production.