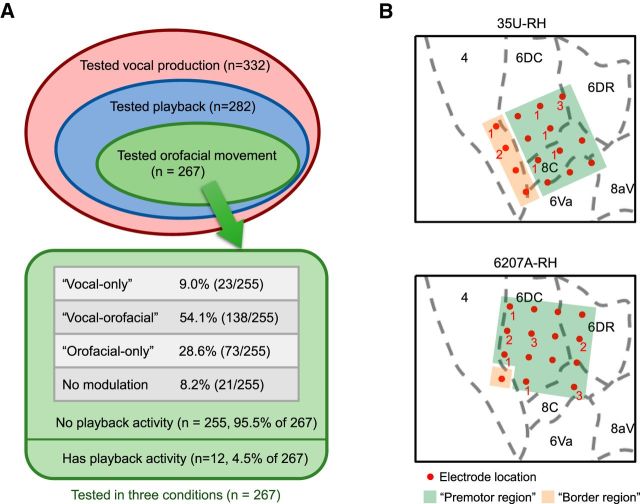
Figure 4.
Summary of neuron distributions in different experimental conditions and response categories. A, Total of 332 single neurons were tested in the vocal production condition from marmosets 35U right hemisphere and 6207A right hemisphere (Table 1). A subset of these neurons (282/332) were also tested in the playback condition. A further subset of those neurons (267/282) were tested in the orofacial movement condition (licking), as illustrated by the Venn diagram. A total of 255 of the 267 neurons tested in all three conditions showed no responses to the playback vocalizations and were classified into four categories (vocal-only, vocal-orofacial, orofacial-only, and no modulation). B, Estimated electrode locations (marked by red dots) of the arrays implanted on two hemispheres (top, 35U right hemisphere; bottom, 6207A right hemisphere) are overlaid on a published marmoset brain atlas (Paxinos et al., 2012). Recordings were made from 15 of 16 electrodes in each array (one electrode in each array was used as the reference and is not marked). The number next to each red dot indicates the number of vocal-only neurons found at that electrode location (no number shown if none was found). Recording locations in premotor region are marked by green-shaded area and those in the border region are marked by yellow-shaded area. Of 255 neurons recorded from both hemispheres, 213 were from the premotor region and 42 were from the border region. The number of neurons in each of the four categories (vocal-only, vocal-orofacial, orofacial-only, and no modulation) are 20 (9.4%), 116 (54.5%), 57 (26.8%), and 20 (9.4%) for the premotor region and 3 (7.1%), 22 (52.4%), 16 (38.1%), and 1 (2.4%) for the border region, respectively.

