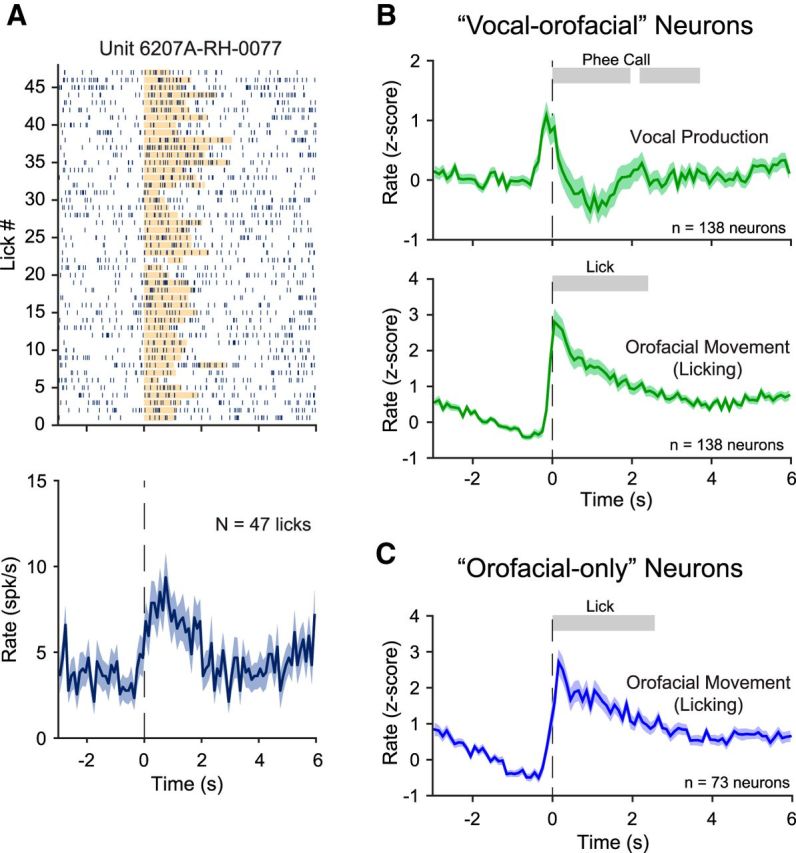
Figure 6.

Neural activities related to orofacial movement (licking). A, Example neuron showing increased activity during orofacial movement (licking). The orange bar in the raster plot indicates the duration of licking. B, Population-averaged normalized firing rates (z-score, mean ± SEM) of the vocal-orofacial neurons in two experimental conditions, vocal production (top) and orofacial movement (licking; bottom). The shaded bars indicate the average durations of each phee call phrase (top) or averaged duration of the licking (bottom). C, Population-averaged normalized firing rates (z-score, mean ± SEM) of the orofacial-only neurons in orofacial movement (licking) condition. The shaded bar indicates the average duration of the licking.
