
Figure 7.
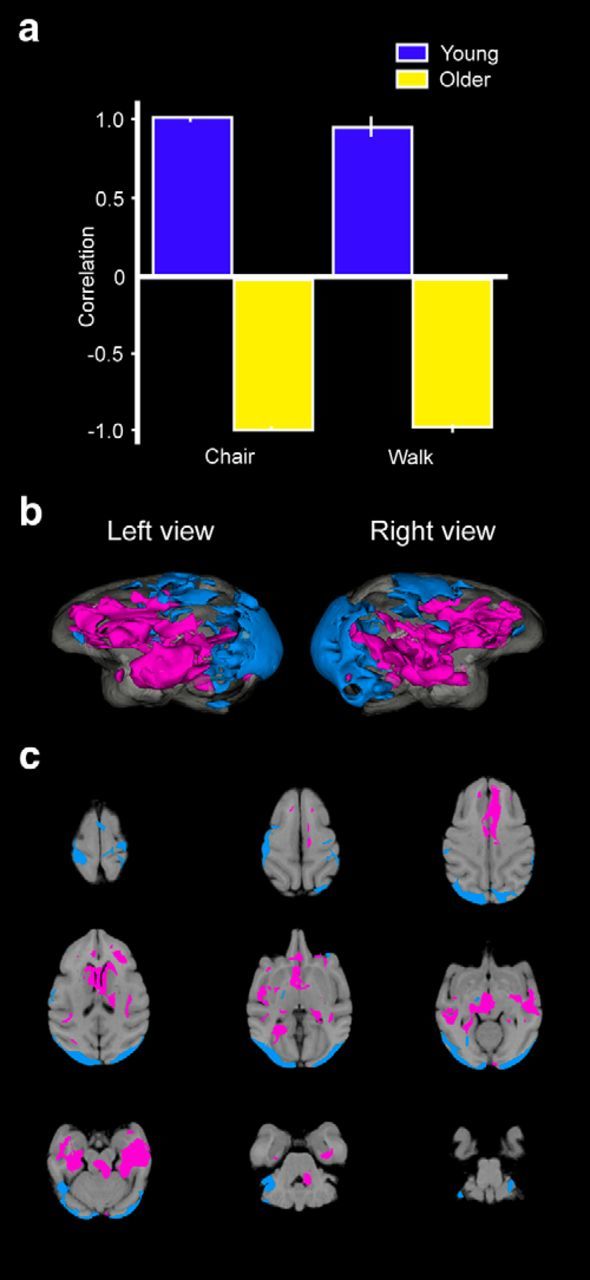
Seed-PLS results for the left orbitofrontal gyrus seed that illustrate regions of the brain that also showed elevated activity during the CHAIR and WALK conditions. Seed-related correlation plots reveal a significant pattern in young monkeys and aged monkeys that was associated the orbitofrontal seed (a). The coactivity pattern from the orbitofrontal seed in young monkeys is reflected in the magenta regions, whereas the coactivity pattern found in older monkeys is reflected in cyan regions. Patterns of FDG metabolism in horizontal slice by slice 2D sections (b) and reconstructed 3D metabolism maps (c) that illustrate the differential functional connectivity of the orbitofrontal seed in young and older animals.