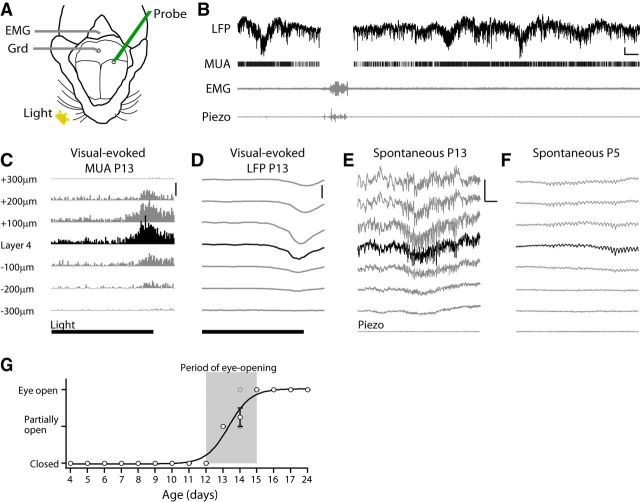
Figure 1.
Experimental design. A, Experimental setup. Recording from V1 using single-shank multielectrode array (Probe) in head-fixed nonanesthetized mice with the ground (Grd) in cerebellum. EMG wire was inserted into the rear neck muscle. Piezoelectric and temperature sensors are positioned under the belly of the animal (data not shown). Visual stimuli (Light) were 100 ms whole-field flashes to the contralateral eye. B, Representative L4 activity in a P13 mouse. Movement was monitored by EMG and Piezo device and these periods were eliminated from analysis to avoid electrical artifacts and equalize state between animals. Scale bar, 200 μV (LFP), 2 s. C, D, Mean visual-evoked responses were used for layer identification (P8–P24). Mean poststimulus MUA firing rate (C) and LFP (D) show an early response in L4, which was used as a reference to identify other layers. Time of light (100 ms) is shown below. Scale bars: C, 300 spikes/s; D, 300 μV. E, Representative spontaneous LFP from a mouse in C and D. L4 can be identified as the point of diminution for rapid oscillations. Scale bar, 500 μV, 500 ms. F, Representative spontaneous LFP from P5 mouse. L4 is identified by depth and diminution of rapid oscillations. Scale bar is as in E. G, Quantification of eye opening. Population mean and SEM are shown in black circles. Individual animals are shown in gray circles. Gray square shows the period of eye opening used in this study.

