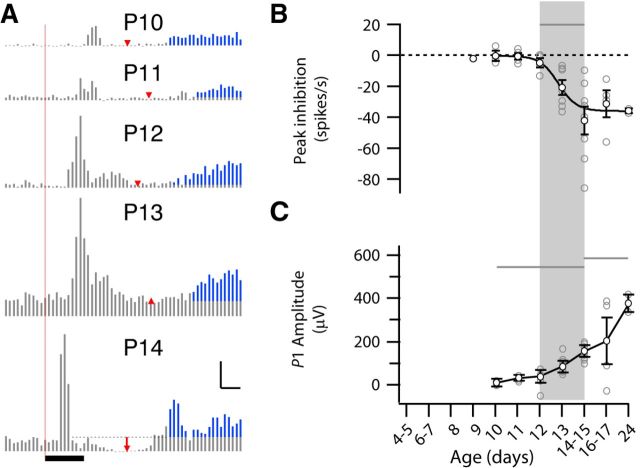
Figure 10.
Development of feedforward inhibition correlated to the loss of secondary response. A, Representative peristimulus MUA time histogram (P10–P14) showing inhibition of spiking between 1° and 2° response (red arrow). The location is determined by lowest spike rate after the 1° response. Scale bar, 100 spikes/s, 50 ms. Black bar indicates stimulus. B, Amplitude of inhibition as change from baseline in spikes/s (ANOVA for effect of age, p < 10−3). Visually evoked inhibition of spiking develops between P12 and P14, the same time evoked spindle bursts disappear. C, Latency of inhibition (minimum spike rate after 1° response; p < 10−3). Development of light-evoked inhibition shortens latency, which now occurs consistently after the initial response.

