
Figure 11.
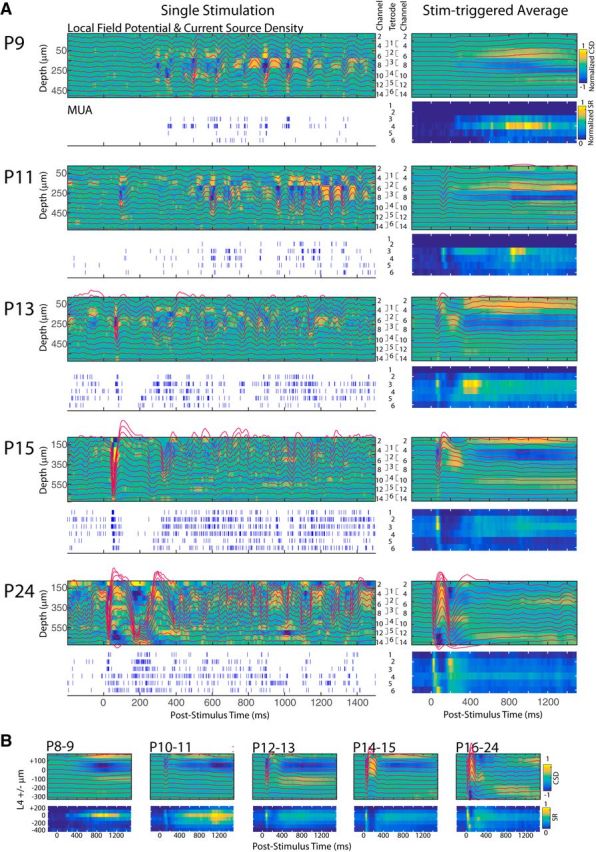
Depth profile of visual evoked responses. A, Left column, Representative single visually evoked response from an animal at key ages. For each animal, the LFP (red line) is overlaid on current source density map (blue is the sink; yellow is the source). Depth of traces is indicated at left; channel number at right. Tetrode configuration for spike recordings is also shown. MUA spike rasters for each tetrode are shown below. A, Right column, Mean visual evoked response for the same animal. MUA spike rates are shown on a color scale. B, Population mean and mean visual response. Depth is aligned to L4 (left).