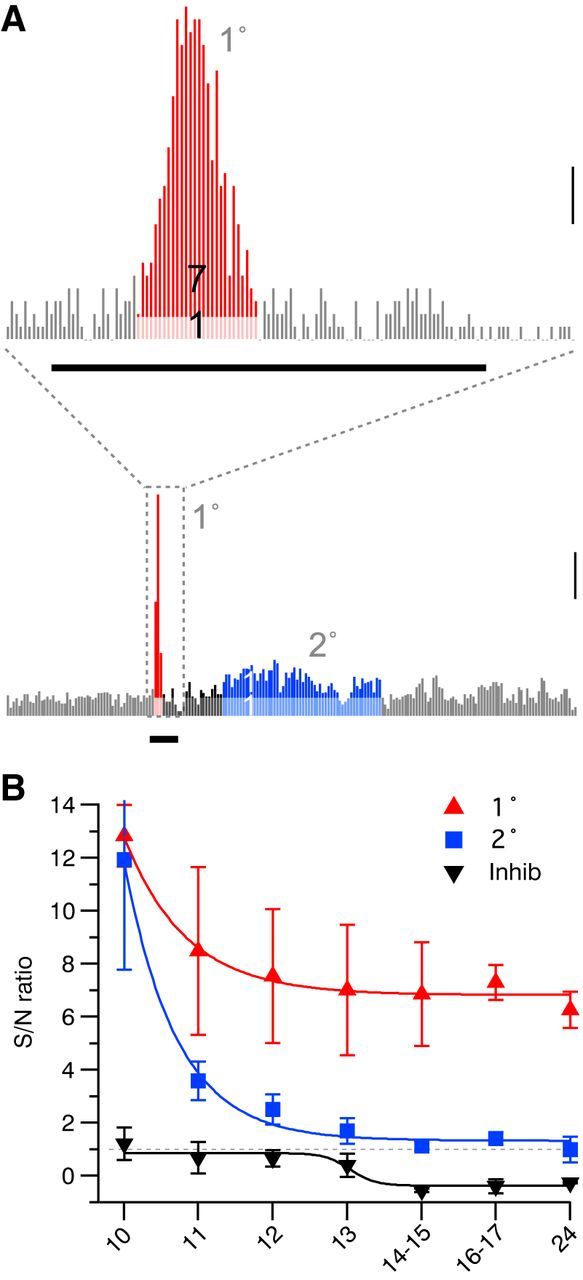
Figure 12.

Differential timing of SNR for visual response components. A, Representative peristimulus MUA time histogram (P13) showing the calculation of SNRs of primary (1°, top, red) and secondary (2°, bottom, blue) responses. Mean baseline spike rate is used to calculate the expected spike rate (light red/light blue) and SNR, the ratio of the increased spike rate to baseline, is indicated in dark red/dark blue. Values of 7:1 for 1° and 1:1 for 2° are shown. Scale bar, 100 spikes/s. The thick black bar shows the visual response (100 ms). B, SNR by age for 1° (red, ANOVA for effect of age p < 10−3), 2° (blue, p < 10−3), and inhibitory spike suppression (black, p < 10−3). 1° and 2° response development were best fit by an exponential with similar decay but different asymptotes. Inhibition was fitted as a sigmoid with an inflection between P12 and P14–P15. Visual response SNR decreases before total response amplitude decreases around P14 (Fig. 7-8), which is correlated with the emergence of inhibition.
