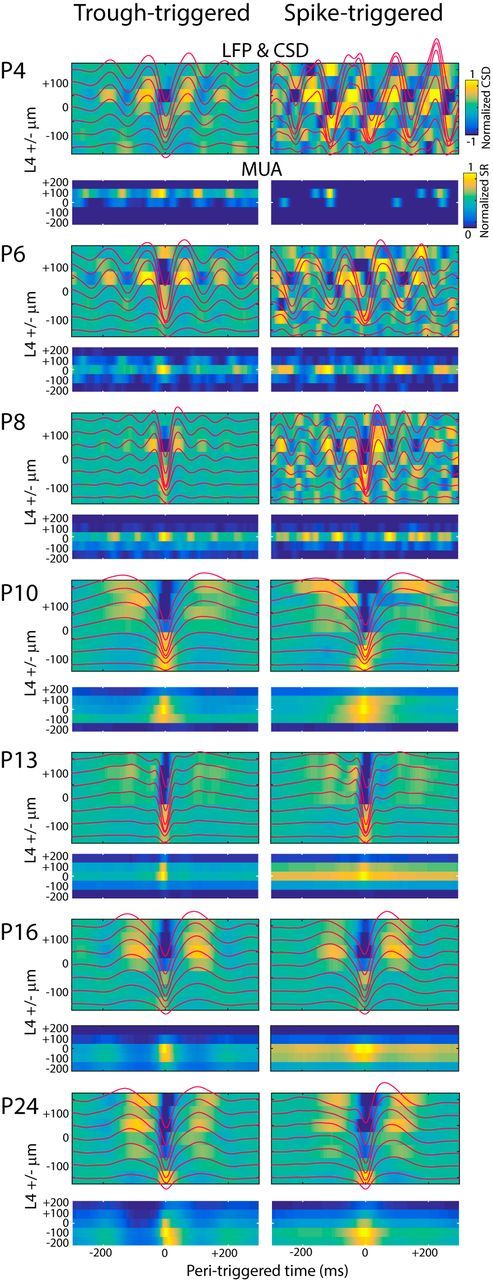
Figure 3.

Depth profile of spontaneous activity. Representative trough-triggered (left column) and spike-triggered (right column) mean LFP (red line), current source density (color map) and MUA (lower color map) for an animal at the shown age. Depth is shown relative to L4, the layer of triggering. For spike-triggered MUA, 0 ms spike rate is removed. From P4–P8, both spike-triggered and trough-triggered averages show local oscillation in LFP and MUA with a current sink and maximal spiking in L4. P10 and older shows activity occurring in more isolated events with full columnar involvement.
