Figure 5.
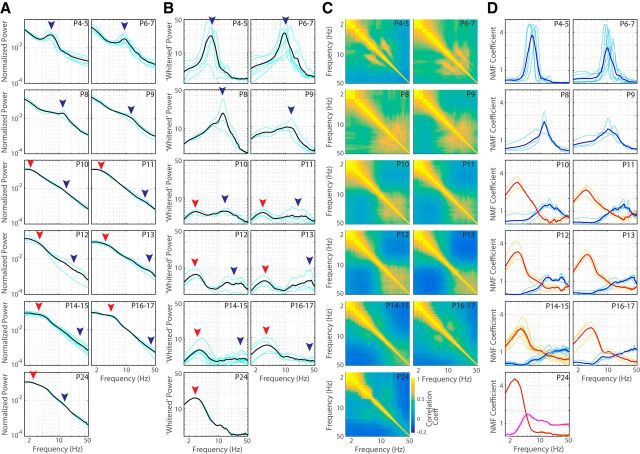
Maturation of two activity patterns explains spontaneous activity development. A, Mean normalized L4 LFP spectra for each age group. Black lines are population mean, blue lines individual animal spectra. P4–P9 spectra are dominated by 5–20 Hz activity (blue arrow; spindle bursts), the primary frequency of which accelerates with age and merges with the dominant 1/f activity by P10. Low-frequency (2–8 Hz) activity becomes apparent at P10 (red arrow) and is prominent on P14–P15, when the spectra become similar to the spectra of juvenile mice during rest (Hoy and Niell, 2015). B, Whitened mean L4 spectra showing frequencies remaining when dominant 1/f power relationship is removed. Shown are increasing frequency and decreasing amplitude of rapid frequencies (blue arrow) and initiation at P10 followed by increasing amplitude of low-frequency activity (red arrow). C, Mean cross-frequency correlation. Shown is the matrix of correlation coefficients for each frequency band. Note the growth of highly correlated 5–15 Hz frequencies at P4–P5, which gradually shift to become correlated high frequencies by P12. Anticorrelation between high and low-frequency bands is observable by P12, showing the development of aroused and quiescent states. D, NMF of spectral signal reveals two developmental components. Thin lines show individual factors identified in each animal. Factors were sorted into clusters by density-based spatial clustering. Two clusters of factors were identified in the total population, which have been rendered in blue and red. Factor 1 (blue) was identified in all animals except P24 and accelerated with age. Spectra could first be separated into two factors on P10. This second factor (red) remains relatively constant with age. A third factor (pink) was isolated on P24 that appeared to contain rapid rhythms of factor 1 and theta-band activity.

