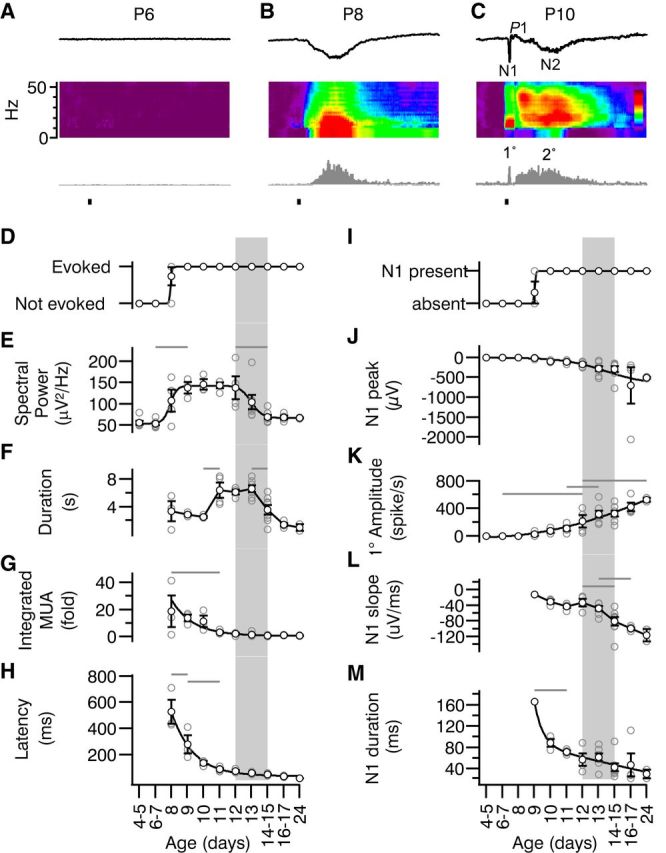
Figure 8.

Primary and secondary visual responses develop by different mechanisms. A–C, Representative L4 visual responses at three early ages showing the designations for the parts of the visual response. From top, mean evoked LFP, spectral increase and peristimulus MUA time histogram. The sharp, short-latency negative potential is called N1 and is followed by long-latency, long-duration N2. The MUA responses are called 1° (N1 + 1° = primary) and 2° (N2 + 2° = secondary), respectively. Note that the P8–P9 responses resemble secondary responses in older animals and are thus classified despite occurring first. At later ages, a positive peak is observed (P1), which is analyzed in Figure 9. D–H, Quantification of total (primary + secondary) L4 visual response development by age. For all panels, gray rectangle indicates period of eye opening (Fig. 1). D, Presence or absence of significant visually evoked MUA. E, Summed 1–50 Hz spectral power during the 5 s after stimulation (ANOVA for effect of age p < 10−3). Evoked spectral power in the LFP is first significantly different from neonates on P9 and remains stably high until decreasing to mature levels between P12 and P14–P15. F, Total duration of elevated spiking (spike rate >1 SD of baseline mean; p < 10−3). Visual responses become very long on P11 before decreasing to adult levels by P14. G, Time-amplitude integrated change in MUA firing rate (total area of gray bars in C and D expressed as the fold increase over baseline; p < 10−3). Early responses are very large but shrink rapidly, becoming similar to mature values by P11 despite increasing duration. H, Latency to MUA response (p < 10−3). Early responses are long latency, but reach values similar to mature values by P11. I–M, Quantification of N1/1°. I, Presence or absence of N1 component of visual evoked L4 potential. J, Peak negative amplitude of mean visual evoked potential (0–200 ms; p = 0.0053). N1 grew in size steadily during development and did not reach clear asymptote within time period of study. K, Peak 1° MUA (0–200 ms after stimulus; p ≪ 10−3). L, Negative slope of N1 (p ≪ 10−3). Rapid increases in slope were observed between from P12 and P16–P17. M, Duration of N1 (p < 10−3). After rapid sharpening between P9 and P10, duration decreased steadily.
