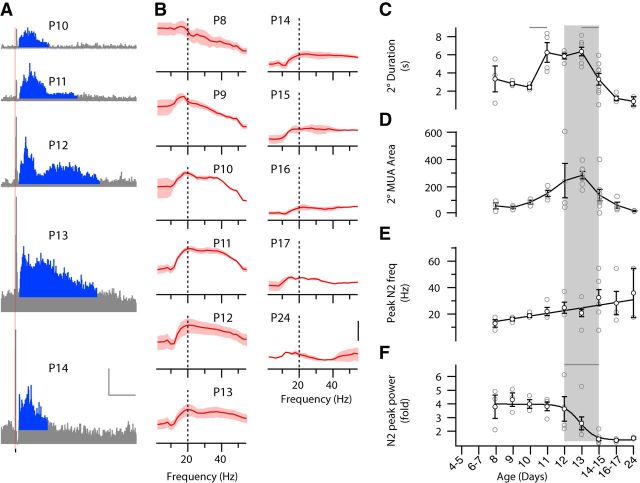
Figure 9.
Immature, large-amplitude secondary responses disappear by eye opening. A, Representative peristimulus MUA time histograms (P10–P14) showing secondary responses. Total mean firing rate for L4 is displayed in gray, with firing elevated (>1 SD) over baseline shown in blue. The 2° duration (C) is the number of seconds of blue signal; the 2° MUA area (D) is the total area of blue. Scale bar, 200 spikes/s, 2 s. B, Fold increase in LFP spectral power during secondary response. Population mean (red line) and SEM (shaded) for animals at indicated age. Scale bar, 4×. Elevated spectral power distribution is similar to the rapid oscillation pattern identified during spontaneous activity (Fig. 4). Evoked oscillation power drops between P12 and P14, similar to the loss of spontaneous rapid frequencies at the same ages. C, Duration of 2° spiking response (ANOVA for effect of age, p < 10−3). Secondary spiking responses shorten between P12 and P14. D, Integrated area of 2°spiking (p = 0.014). Evoked spiking peaks at P13 before decaying to adult levels. E, Peak frequency of N2 (p < 10−3). Like spontaneous activity, evoked N2 oscillations began as spindle bursts and steadily increased to broadband β-gamma frequencies. F, Peak fold increase in spectral power of N2 (p < 10−3) is high through the pre-eye-opening period.

