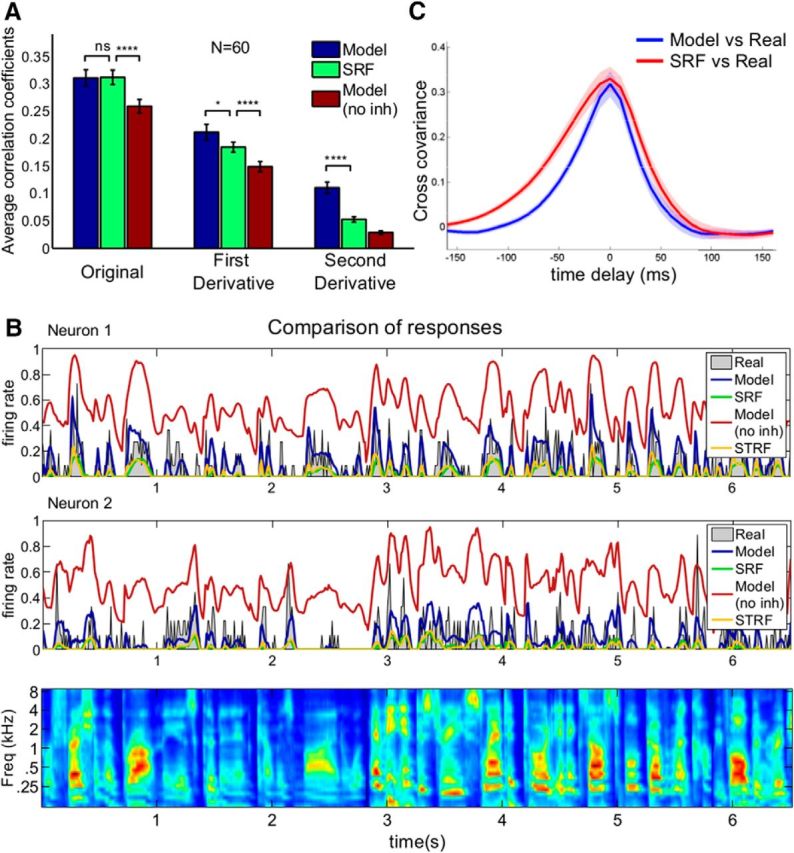
Figure 4.

Prediction of neuronal activity by different models. A, Comparison of average correlation coefficients (10-fold cross-validated) between the activity of 60 auditory neurons and their predicted responses by the intact Bayesian decoding model, SRF model, and Bayesian model without inhibition. Bayesian decoding model and SRF predictions are comparable (left; cc = 0.31 for both) and provide a better fit to real responses compared with the model without inhibition (cc = 0.26, p < 10−10, paired t test). For comparison, full STRFs reach a performance of cc = 0.38, significantly higher than the simplified encoding and decoding models. However, the first and second derivatives of the intact Bayesian decoding model responses (middle and right panels) fit the neural responses' first and second derivatives significantly better than the SRF predictions (p < 0.05 and p < 10−6, respectively). The Bayesian model better captures the detailed dynamics of the responses. Error bars indicate SEM. B, Comparison of measured neural responses for two example neurons (gray in both panels) with their inference model predictions with or without inhibition (blue and red, respectively), SRF model prediction (green), and STRF prediction (yellow). C, Cross-covariance between inference model versus real responses and between SRF versus real responses shows that model responses are temporally more precise than SRF responses. Shaded areas represent the 95% confidence intervals. *p < 0.05; ****p < 10−4.
