
Figure 2.
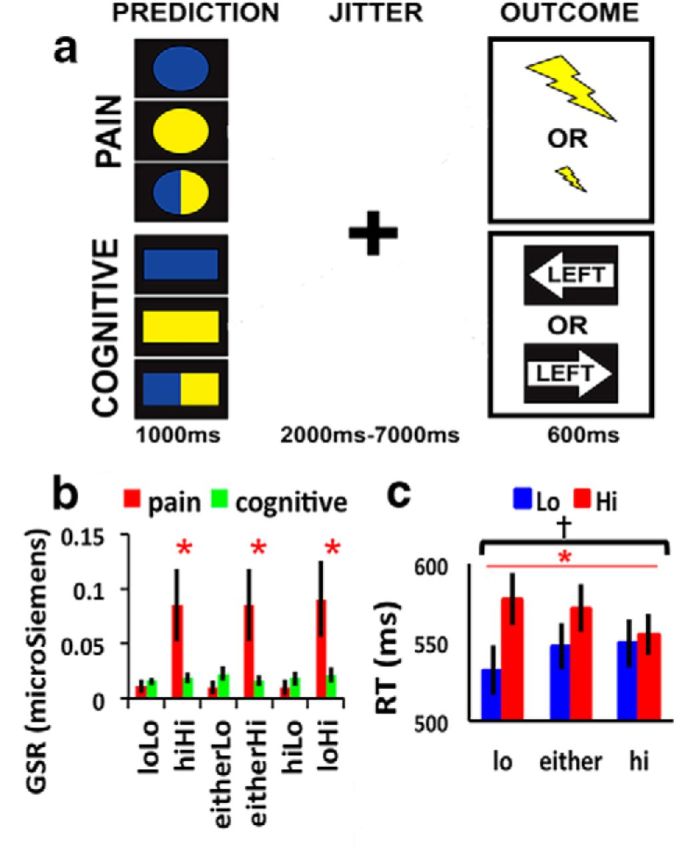
Procedure and behavioral results. A, Task. During the prediction phase, subjects are presented with a cue signaling whether the outcome will be electrical shock or a spatial stimulus, as well as the probability of whether it will be a high aversion or low aversion outcome. Cues that are half blue and half yellow always signify that there is an equal chance of receiving either a more aversive or less aversive outcome; the probabilities signified by either blue or yellow cues were counterbalanced across subjects. Circles represent electrical shock condition. Rectangles represent spatial condition, The meaning of the shapes was also counterbalanced across subjects. The prediction phase is followed by a jittered interval, and then the outcome of either an electric shock or a spatial stimulus. B, GSR across pain and cognitive outcomes. C, RTs across conflict conditions. Error bars indicate SEM. *Main effect, p < 0.001. †Interaction, p < 0.05.