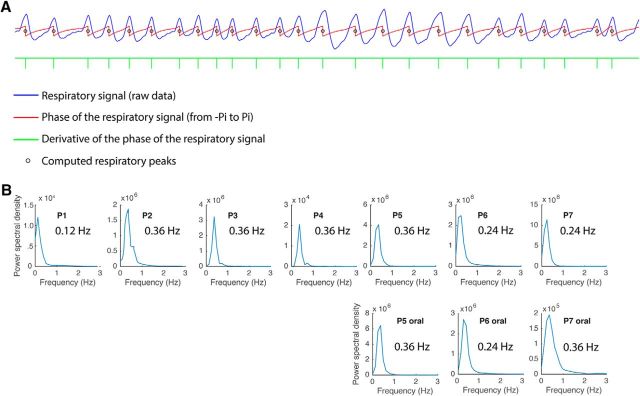
Figure 1.
Respiratory analysis method and breathing frequency data across patients. A, A representative trace of the raw respiratory signal from one patient is shown in blue. To define respiratory events for the LFP analyses, the instantaneous phase of the respiratory time series (obtained from the angle of the Hilbert transform) was computed (red trace). The peak of inspiratory flow occurs at the abrupt transition in the instantaneous phase from π to −π, and can be detected as a deflection in the derivative of the phase of the respiratory signal (green tick marks). The small black circles on the respiratory phase waveform (in red) denote the points of peak flow, which align well to the inspiratory peaks of the raw respiratory signal (in blue). B, Fast Fourier transform analysis was used to characterize the dominant breathing frequency in each patient. Each panel represents one patient (P1–P7).

