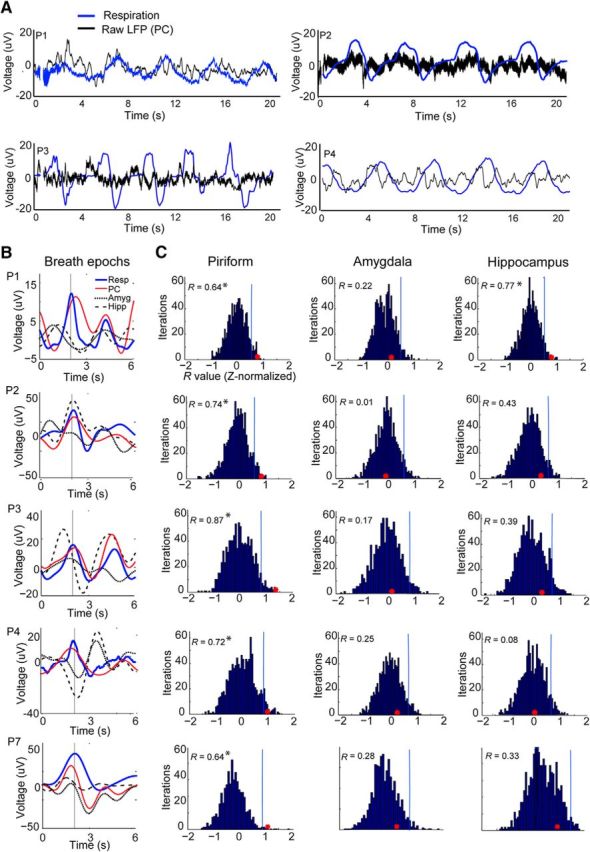
Figure 2.

Slow oscillations in human PC are in phase with respiration. A, Representative traces of the raw LFP time series from five patients with PC coverage show that slow fluctuations in PC (black) are in phase with inhalation (blue) across a series of breaths. Inspiration is in the upward direction in this and all panels. Patients are labeled, for example, as P1, P2, P3, etc., in chronological order of study enrollment. Note that the Nihon Kohden acquisition system allows recording oscillations as slow as 0.08 Hz, well below the respiratory range. B, Patient-specific time-course plots depict the mean respiratory waveform (red) and the mean LFP signal in PC (black), amygdala (dotted line), and hippocampus (dashed line), filtered between 0 and 0.6 Hz, temporally aligned to the peak of inspiratory flow (at 2 s), and averaged over all trials. Across all patients, the LFP signal most consistently conforms to the respiratory rhythm in PC (each row represents data from one patient). C, The correlation (R value) between the mean respiratory signal and the mean LFP signal is shown as a red dot for each patient in PC, amygdala, and hippocampus. These values are overlaid on histograms of R value null distributions (z-normalized) computed from 6 s LFP trials randomly aligned to the onset times of peak inspiratory flow. Correlations were statistically significant in all patients in PC. *p < 0.05.
