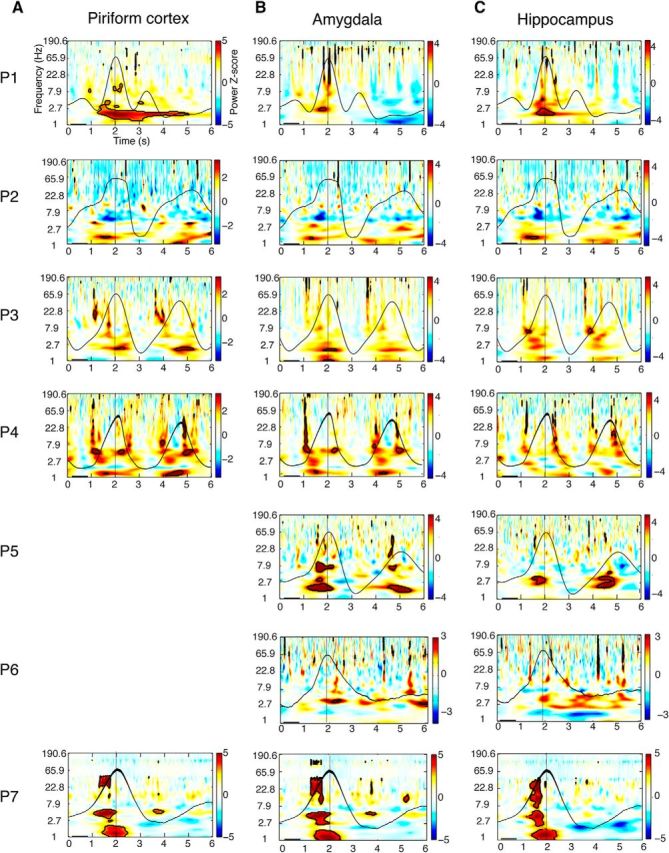
Figure 4.

Respiration entrains higher-frequency oscillations in PC, amygdala, and hippocampus. A–C, Time–frequency spectrograms for each patient were computed across trials and aligned to peak inspiratory flow at time = 2 s (vertical black lines). Each patient's averaged respiratory signal (black waveform) is overlaid on the corresponding spectrogram. The pseudocolor scale represents the mean spectral power (z-normalized) averaged over all breaths, on a patient-by-patient basis, relative to a preinhalation baseline period between 0.2 and 0.8 s (horizontal black bars). In PC (A) and amygdala (B), delta power significantly emerges during the inspiratory phase of breathing in each patient. Significant increases in delta power were also observed in hippocampus (C), although effects did not reach corrected significance in P3, P4, and P5. Time–frequency clusters, where spectral power survived statistical correction (FDR) for multiple comparisons (at z > 3.2), are outlined in black. Note, data from PC were not recorded in P5 and P6.
