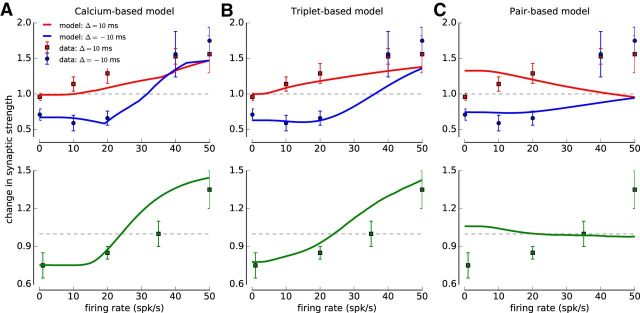
Figure 1.
Pair-, triplet-, and calcium-based models and visual cortex plasticity data from regular and jittered spike-pairs. A–C, The change of the synaptic strength is shown as a function of the spike-pair presentation frequency for regular pre-post pairs (top row; Δ = 10 ms, red squares and lines), regular post-pre pairs (top row; Δ = −10 ms, blue circles and lines), and jittered spike-pairs (bottom row; green squares and lines) as occurring in the calcium-based (with linear calcium dynamics, A), the triplet-based (B), and the pair-based (C) models. Only the calcium- and the triplet-based models are fitted to the experimental data. The data-points are taken from plasticity experiments in cortical slices (mean ± SEM) (Sjöström et al., 2001).

