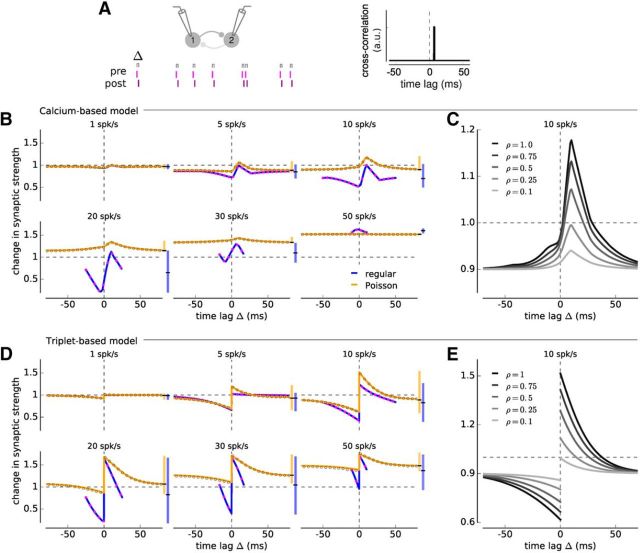
Figure 3.
Change in synaptic strength in response to irregular and regular spike-pairs in the calcium- and triplet-based models. A, Illustration of two neurons driven to fire irregular spike-pairs with fixed time lag Δ (top). The cross-correlation function of irregular spike-pairs is given by a δ function with a peak at Δ. B, Change in synaptic strength as a function of the time lag between presynaptic and postsynaptic spikes for irregular (orange) and regular spike-pairs (blue) at different firing rates for the calcium-based model with linear calcium dynamics. Vertical range bar on the right of each panel in the same color represents the range of synaptic changes attained at each rate and for both cases. Vertical black line in the range bar indicates the baseline change in synaptic strength. Gray and magenta open circles represent simulations of the full model with irregular and regular spike-pair stimulations. C, Change in synaptic strength as a function of Δ for different pre-post correlation coefficients ρ for the calcium-based model with linear calcium dynamics. Same depiction as in B, but for several values of ρ. The firing rate of presynaptic and postsynaptic neurons is 10 spk/s. D, E, Same as B, C, but for the triplet-based model. All changes are in response to a stimulation for 10 s. Presynaptic and postsynaptic neurons have identical firing rates.

