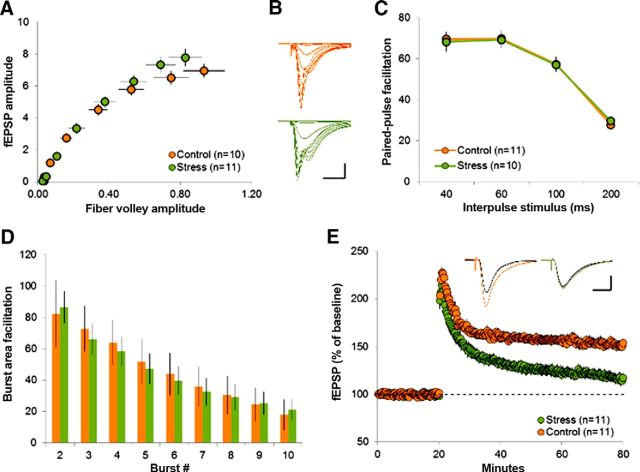
Figure 2.
Multiple concurrent acute stresses impair LTP at area CA1 Schaffer–commissural synapses. A, Graph comparing the fEPSP and fiber-volley amplitudes in response to increasing intense stimulation in slices prepared from control (brown) and stressed (green) animals. Note that no difference was detected in slices prepared from the two groups (n = 5–6 mice per group). B, Representative fEPSPs recorded from slices from control (brown) and stressed (green) mice in response to increasing stimulation intensity. Scale bars: y = 1 mV, x = 20 ms. C, Graph illustrating PPF associated with different interpulse intervals in control (brown) and stressed (green) mouse slices demonstrates no group differences. D, Bar graph summarizing the effect of burst number on response size in control (brown) and stressed (green) mouse slices. E, LTP after delivery of TBS was attenuated in slices from stressed (green) mice compared with controls (brown) within 10 min of induction. Representative traces from baseline (black lines) and 30 min after induction (colored lines) are shown. All slices in the stress group were prepared from animals <1 h after the concurrent acute stresses (*p < 0.01 for minutes 30–80). Results are shown as means ± SEM. Values in parentheses are the numbers of slices from n = 5–6 mice.

