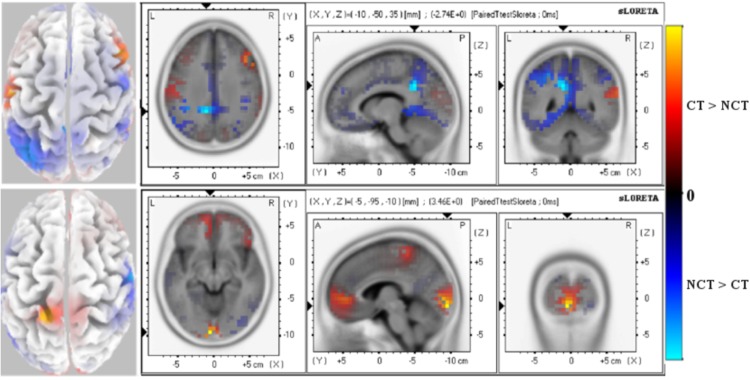
Fig 7. Late Response (200-260 ms) N200 ERP.
Paired t-test values of significant potential amplitude differences at electrodes are illustrated at a significance level as specified. Views are axial, saggital and coronal. The left column shows the distribution on the scalp. All 62 electrodes were used as entries to the data matrix Φ. (Top): Raw ERP N200 with significance level P = 0.05. (Bottom): ERM5 extracted from the ERP N200 with significance level P = 0.01. Red color (positive paired T-test values) indicates that the ERP amplitude for the stimulus condition CT is larger than for condition NCT while blue color (negative paired T-test values) indicates that the ERP amplitude for the stimulus condition NCT is larger than for condition CT.

