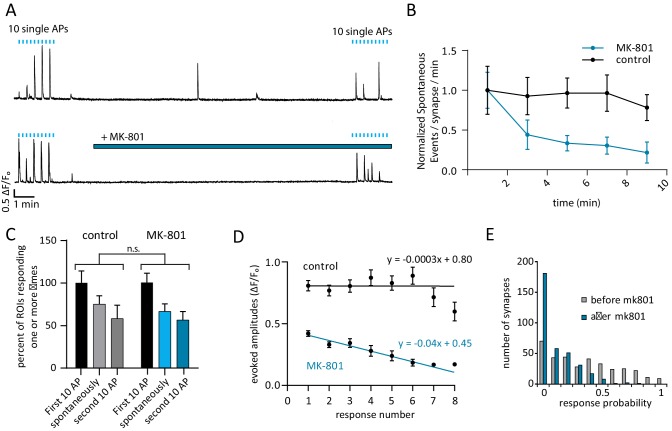
Figure 3. Use-dependent NMDAR blocker MK-801 can selectively silence spontaneous signals without effecting evoked responses within the same synapse.
(A) Example traces outlining the experiment with (top) and without (bottom) MK-801 treatment. 10 action potentials were evoked, 10 s apart (blue tick marks). 4 min later, perfusion was changed to Tyrode’s solution containing 10 µM MK-801 or vehicle. After 10 min in this solution, 10 additional action potentials are evoked, 10 s. Please note that sample traces were selected among examples that are on the larger the side of the average values (especially those after MK-801 application) for better visualization of the impact of MK-801 block on single events (B) Plot shows normalized spontaneous event frequency over the stimulation-free 10 min treatment with MK-801 or control solution. For MK-801 N = 350 ROIs from 7 cells and three cultures. For the control condition, N = 300 ROIs from 6 cells and five cultures. (C) Bars show the percentage of ROIs that respond one or more times to either the first round of 10 stimulations, the second round of 10 stimulations, or spontaneously respond during the intervening time. Control cells (vehicle treatment) and MK-801 treated cells are compared and show no significant differences. (D) Average amplitudes as ∆F/Fo for each nth response within an ROI (per response not per stimulation, failures to respond are skipped so ‘zeros’ are not averaged). For both groups, fit line generated via linear least squares method. (E) Histogram showing distribution of evoked response probabilities in cells before and after MK-801 treatment.

