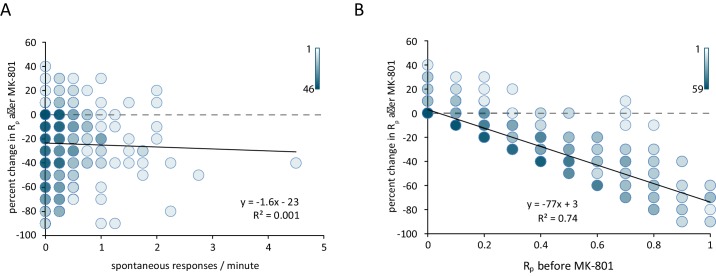
Figure 4. Reduction in postsynaptic responses by MK-801 correlates with evoked response probability but not spontaneous response rate.
(A) Scatter plot of change in Rp (before – after MK-801) vs spontaneous response rate before MK-801 was added. Shading indicates overlapping data points. For both plots N = 350 ROIs from 7 cells and five cultures. (B) Scatter plot of the change in Rp after MK-801 treatment vs initial evoked response rate. Linear fit lines generated via least squares method.

