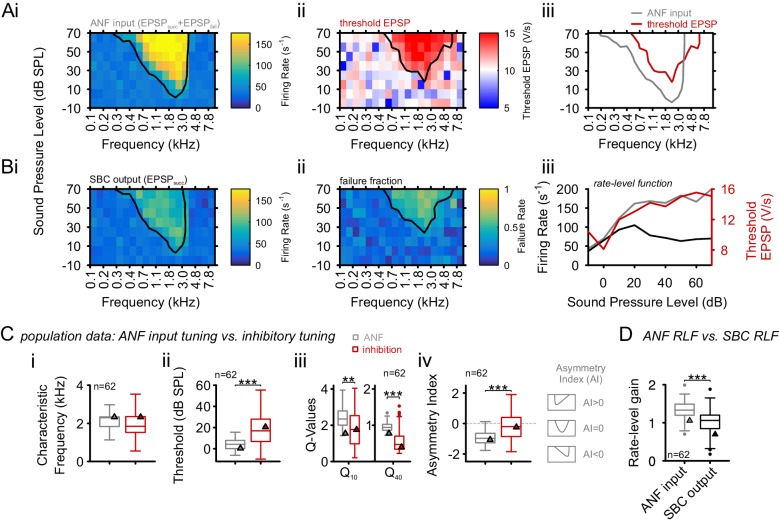
Figure 3. Inhibition at SBC is co-tuned with excitation and broadband, not off-CF and narrowband.
(A) i: Representative frequency response area (FRA) of the excitatory ANF input (EPSPfail and EPSPsucc) characterized by a well-defined CF, the typical steep high-frequency flank, the formation of a low-frequency tail, and the absence of frequency-intensity domains of inhibition. ii: The same recording showed elevated threshold EPSPs throughout most of the excitatory response area and extending up to two octaves above CF. The frequency, where the lowest relative intensity caused elevated threshold EPSP, matched the units CF. iii: For the same unit, comparison of excitatory (ANF, gray) response area and frequency-intensity domain of inhibition (threshold EPSP elevation, red). The inhibitory domain was symmetrically arranged around the unit’s CF. (B) i: FRA of the SBC output (EPSPsucc) shows a considerable reduction in firing activity compared to the ANF input. ii: Failure fraction, i.e. the proportion of EPSPfail. The increase in failure fraction is most prominent around the units CF. Note the similarity of the frequency-intensity domains of EPSP threshold increase and the respective domains with increased EPSPfail in Aii. iii: Rate-level functions of ANF input (gray line, left ordinate) and SBC output (solid black line, left ordinate) compared to threshold EPSP (red, solid line, right ordinate). Increasing sound pressure levels result in a monotonic increase in ANF firing and correspondingly the threshold EPSP shows a monotonic increase. The SBC output is maximal at 20 dB SPL and declines towards higher stimulus intensities. (C) Population data: comparison of excitatory (ANF, gray) and inhibitory (threshold EPSP, red) FRA indicates (i) on-CF inhibition although (ii) with higher thresholds (p<0.001, paired t-test), which is (iii) broadly tuned (Q10: p<0.01, Q40: p<0.001, two-way RM ANOVA), and (iv) shows a more symmetric tuning (p<0.001, paired t-test; the schematic drawing on the right indicates FRA shapes for different asymmetry indices). (D) Finally, the rate-level functions were shallower and showed a reduced gain in firing rate in the output compared to the input. SBC = spherical bushy cell, CF = characteristic frequency, EPSP = excitatory postsynaptic potential, ANF = auditory nerve fibers, FRA = frequency response area.
DOI: http://dx.doi.org/10.7554/eLife.19295.007

