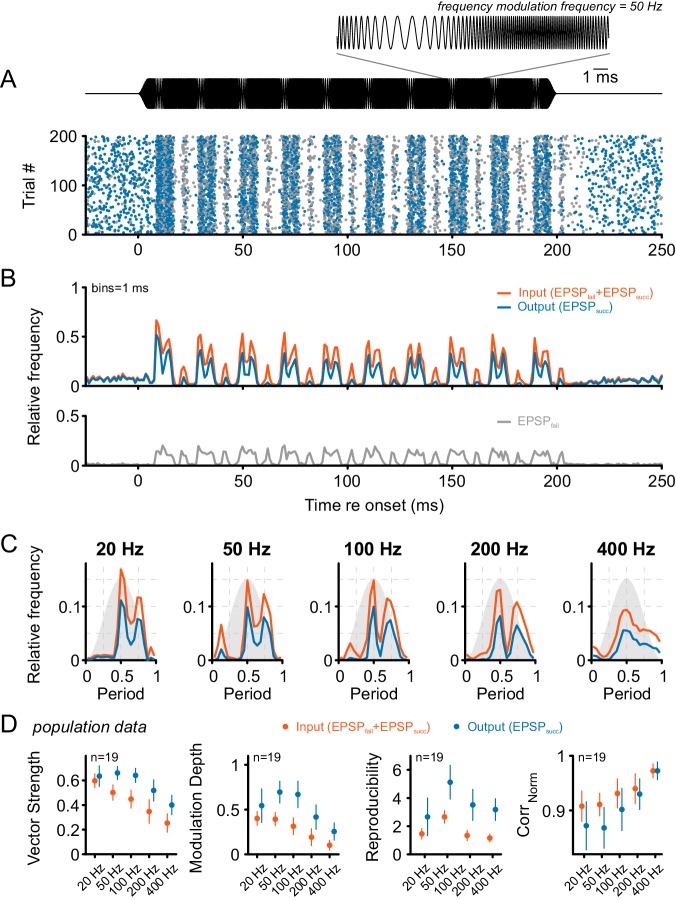
Figure 6. Tone bursts with sinusoidal frequency modulations (SFM) of different modulation frequencies were used to investigate the input-output function under the condition of dynamically altered frequency profiles.
Overall, SFM testing revealed improved temporal precision and across-trial reproducibility across the ANF-SBC synapse. (A) The upper panel (black) shows the SFM stimulus with a detail enlargement visualizing the dynamic frequency modulation. The dot-raster plot (lower panel) shows the activity of a representative SBC (CF = 1.8 kHz) to 200 stimulus repetitions with a differentiation between EPSPsucc (blue) and EPSPfail (gray). (B) Histogram of the discharge activity shown in A. Upper panel: blue = EPSPsucc, gray = EPSPfail, orange = ANF input, i.e. EPSPsucc+EPSPfail. Lower panel: The EPSPfail is also locked to the SFM but showed reduced fine structure compared to the ANF input. (C) Period histograms for the same cell as in A and B at different modulation frequencies (orange = ANF input, blue = SBC output). Design of the graph is identical to Figure 5C. Note the multiple peaks of the response in the period histogram. (D) Population data for 19 cells: Across all frequencies tested, the SBC output shows increased vector strength (left; p<0.001, two-way RM ANOVA), higher modulation depths (mid left; p<0.001, two-way RM ANOVA), and better across-trial reproducibility (mid right; p<0.001, two-way RM ANOVA) compared to its ANF input. The stimulus reproduction (CorrNorm) was consistently lower at the SBC level (right; p<0.001, two-way RM ANOVA). Markers indicate mean ± standard deviation.
DOI: http://dx.doi.org/10.7554/eLife.19295.013

