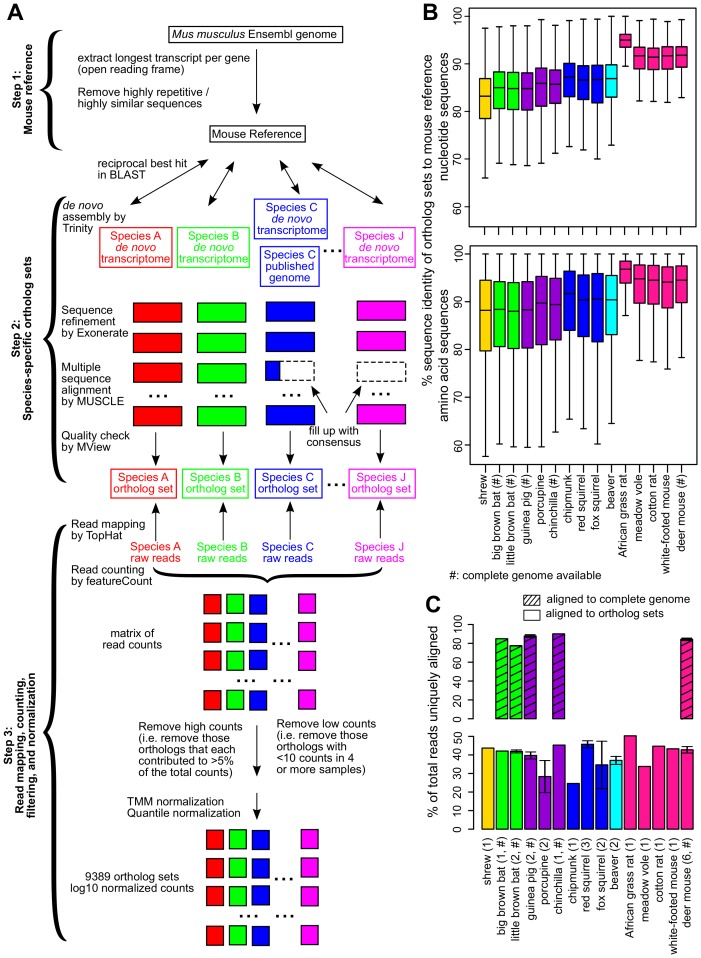
Figure 2. Cross-species analysis of gene expression in cultured skin fibroblasts.
(A) Pipeline to obtain the species-specific ortholog sets and expression values. See Materials and methods or a more detailed description of the methodology. (B) Sequence identity of ortholog sets compared to mouse. Nucleotide and amino acid sequence identity of the ortholog sets in each species was compared to mouse reference (mouse was set as 100%). The ortholog sequences were based on de novo assembled transcriptomes, as well as NCBI genomes (if available; indicated by ‘#’). The box plot shows the distribution across the 9389 gene orthologs, with the central bars indicating median values. (C) Read alignment rates for mapping to complete genomes and ortholog sets. Percent of total reads that could be uniquely aligned to the complete genomes (if available, indicated by ‘#’; shaded bars) or to the ortholog sets are shown. Error bars refer to standard error of mean. Number of samples (biological and technical replicates) per species is indicated in parenthesis.


