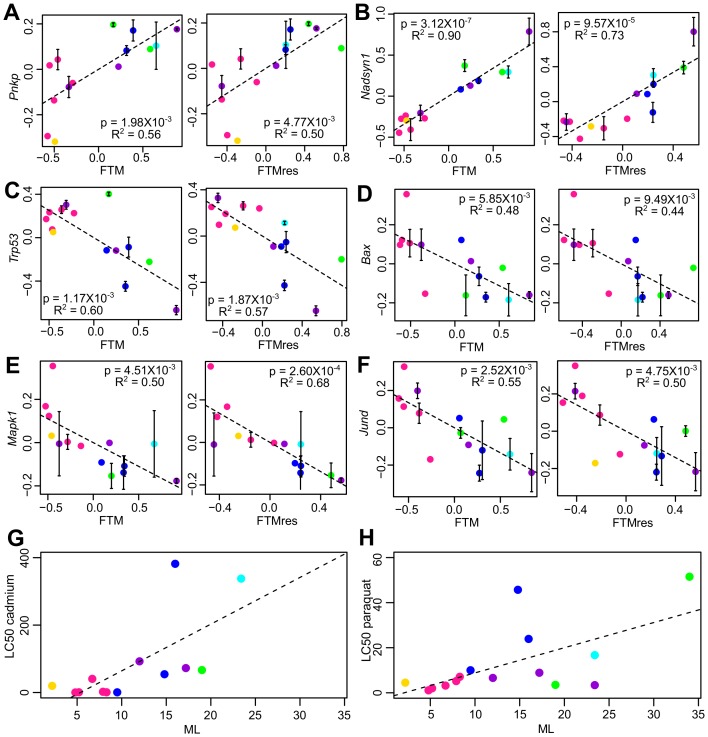
Figure 4. Selected genes and stress resistance conditions with significant correlation to longevity.
(A) Pnkp and (B) Nadsyn1 show positive correlation with the longevity traits. (C) Trp53, (D) Bax, (E) Mapk1, and (F) Jund show negative correlation with the longevity traits. In each plot, the gene expression values (vertical axis) and the longevity traits (horizontal axis; FTM: Female Time to Maturity; FTMres: Female Time to Maturity Residual) are centered at 0 on log10 scale and then transformed by the best-fit variance-covariance matrix under phylogenetic regression (i.e. to remove the phylogenetic relationship). The potential outlier point has been removed and the remaining points are shown on the plot and colored by taxonomic group (same color scheme as in Figure 1). The regression slope p value (i.e. p value.robust) and R2 value are indicated. Error bars indicate standard error of mean. Resistance to (G) cadmium and (H) paraquat treatments. In each plot, the lethal dose (LD50) values (vertical axis) and the longevity traits (horizontal axis; ML: Maximum Lifespan) are plotted on ordinary scale (without log transformation). The regression slope p values are 9.16 × 10⁻³ and 1.39 × 10⁻², respectively.

