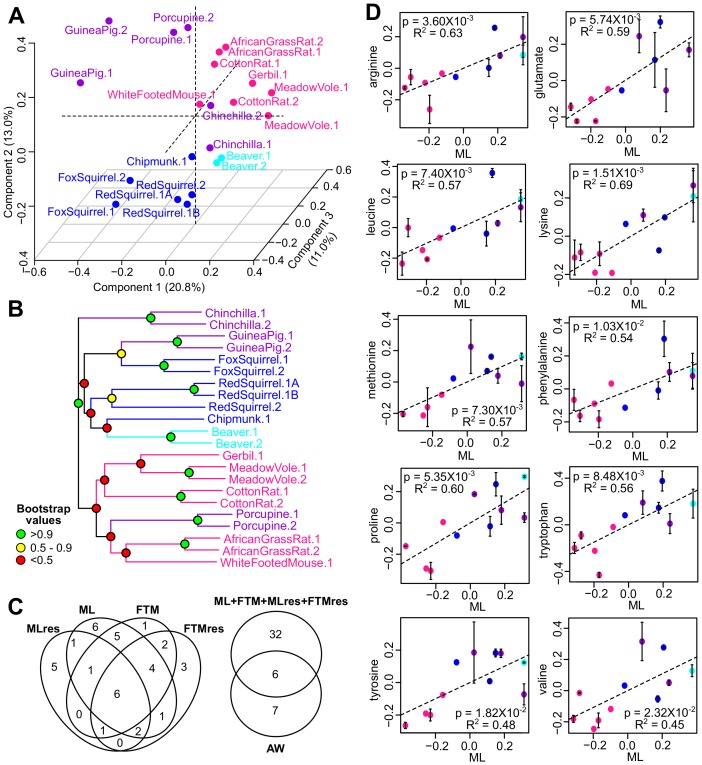
Figure 5. Metabolite variation and correlation with longevity.
(A) Projection of the first three Principal Components (PCs) in Principal Component Analysis. Values in parenthesis indicate percent of variance explained by each of the PCs. Points are colored by taxonomic order (same color scheme as in Figure 1) (B) Metabolite phylogram. Color of the nodes indicates the result of 1000 times bootstrap. (C) Overlap of metabolites associating with Adult Weight and longevity traits. AW: Adult Weight; ML: Maximum Lifespan; FTM: Female Time to Maturity; MLres: Maximum Lifespan Residual; FTMres: Female Time to Maturity Residual. (D) Amino acids showing positive correlation with Maximum Lifespan (ML). In each plot, the amino acid levels (vertical axis) and the longevity traits (horizontal axis) are centered at 0 on log10 scale and then transformed by the best-fit variance-covariance matrix under phylogenetic regression (i.e. to remove the phylogenetic relationship). The potential outlier point has been removed and the remaining points are shown on the plot and colored by taxonomic group. The regression slope p value (i.e. p value.robust) and R2 value are indicated. Error bars indicate standard error of mean.


