. 2016 Nov 18;5:e21167. doi: 10.7554/eLife.21167

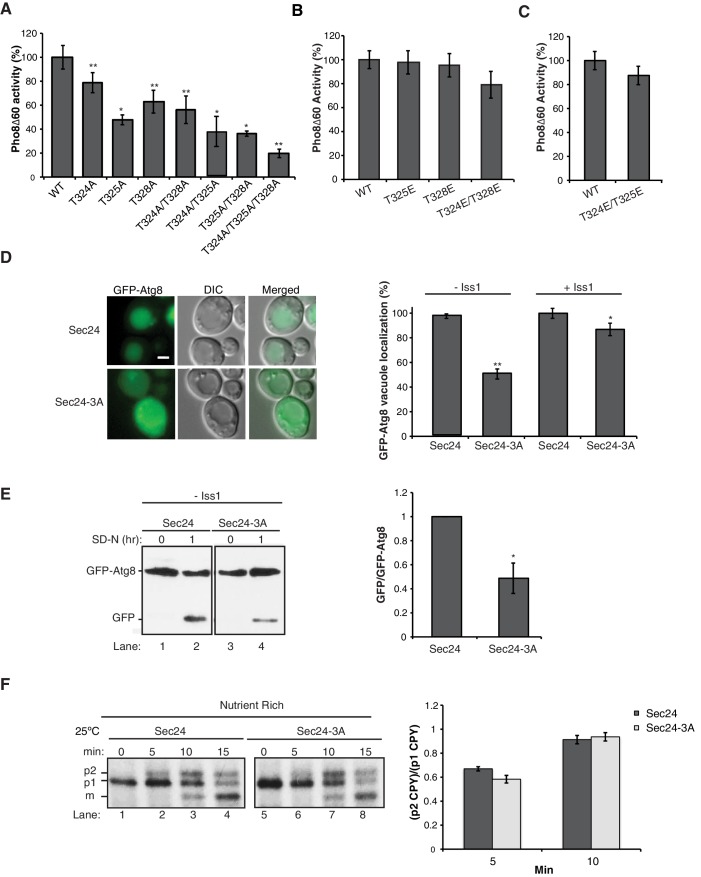
Figure 2. Phosphorylation of T324/T325/T328 in Sec24 is required for autophagy, but not ER-Golgi transport.

(A) Vacuolar alkaline phosphatase activity was assayed in lysates prepared from a sec24∆iss1∆ deletion strain harboring sec24 alanine mutations. The activity of wild-type (WT) 2 hr after starvation was set as 100% and 0 time-point values were subtracted. Averages and s.e.m. are shown for 3 (or four for T324A/T325A) biological replicates. p-values=0.006 (T324A), 0.012 (T325A), 0.009 (T328), 0.008 (T324A/T328A), 0.02 (T324A/T325A), 0.01 (T325A/T328A), 0.006 (T324A/T325A/T328A), Student’s paired t-test. (B, C) As in (A) except activity was assayed in extracts from phosphomimetic mutations in sec24∆iss1∆ (B) or sec24∆ (C) deletion strains. Averages and s.e.m. are shown for three biological replicates. p-values=0.88 (T325E), 0.78 (T328E), 0.32 (T324E/T328E), 0.26 (T324E/T325E), Student’s paired t-test. (D) The translocation of GFP-Atg8 to the vacuole was examined 1 hr after nitrogen starvation at 25°C in sec24∆iss1∆ and sec24∆ deletion strains in either the presence of WT Sec24 or Sec24-3A. Representative images (left) and quantification from 300 cells (right) are shown. Scale bar 2 µm. WT was set to 100% for each experiment and had an average vacuolar localization of 76% (sec24∆iss1∆) and 86% (sec24∆). Averages and s.e.m. are shown for three biological replicates. p-values=0.006 (sec24∆iss1∆), 0.02 (sec24∆), Student’s paired t-test. (E) Cleavage of GFP-Atg8 was examined in sec24∆iss1∆ cells expressing Sec24 or Sec24-3A 1 hr after starvation at 25°C (left). The ratio of free GFP to GFP-Atg8 was quantitated. The cleavage in WT was set to 1 (right). Averages and s.e.m. are shown for three biological replicates. p-value = 0.015, Student’s unpaired t-test. (F) sec24∆iss1∆ cells expressing Sec24 (lanes 1–4) or Sec24-3A (lanes 5–8) were pulse-labeled for 4 min and chased for the indicated times (left). The p1 (ER), p2 (Golgi) and m (vacuolar) forms of CPY are labeled. Quantitation of the ratio of p2/p1 CPY for the 5 and 10 min time points are shown (right). Averages and s.e.m. are shown for three biological replicates. p-values=0.08 (5 min), 0.66 (10 min), Student’s unpaired t-test. *p<0.05; **p<0.01.

DOI: http://dx.doi.org/10.7554/eLife.21167.006

Figure 2.

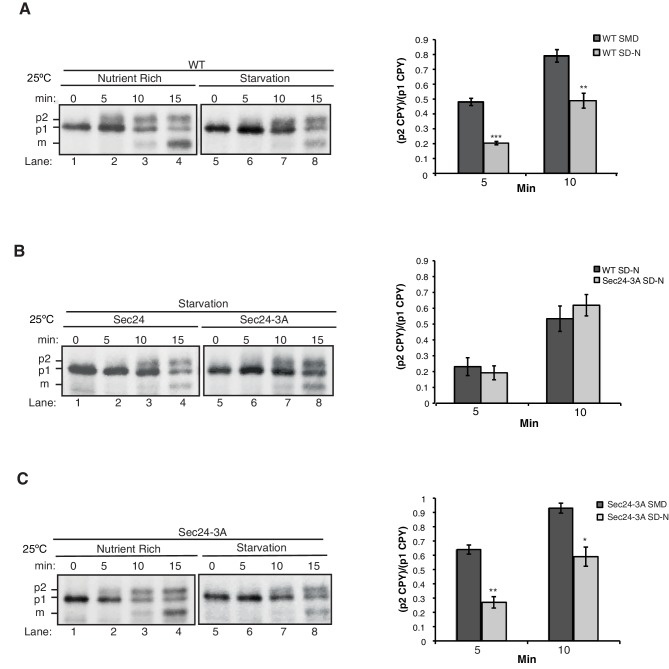
Figure 2—figure supplement 1. ER-Golgi transport is delayed during autophagy.

Figure 2—figure supplement 1.

(A) WT cells were grown in nutrient rich media (SMD) (lanes 1–4) or starved for nitrogen (SD-N) for 1 hr at 25°C (lanes 5–8). Cells were pulse-labeled for 4 min and chased at the indicated times as described in the Materials and Methods before CPY was immunoprecipitated. ER (p1), Golgi (p2) and vacuolar (m) forms of CPY are labeled (left). Ratio of p2 to p1 CPY was determined (right). Averages and s.e.m. are shown for three biological replicates, p-values=0.0005 (5 min) and 0.009 (10 min), Student’s unpaired t-test. (B) As in (A) except sec24∆iss1∆ cells expressing Sec24 or Sec24-3A were starved for nitrogen for 1 hr at 25°C (left). Ratio of p2 to p1 CPY was determined (right). Averages and s.e.m. are shown for three biological replicates. p-values=0.46 (5 min) and 0.96 (10 min), Student’s unpaired t-test. (C) As in (A) except Sec24-3A cells were grown in nutrient rich media (SMD) (lanes 1–4) or starved for nitrogen (SD-N) for 1 hr at 25°C (lanes 5–8). Averages and s.e.m. are shown for three biological replicates, p-values=0.0015 (5 min) and 0.01 (10 min), Student’s unpaired t-test. *p<0.05; **p<0.01; ***p<0.001.
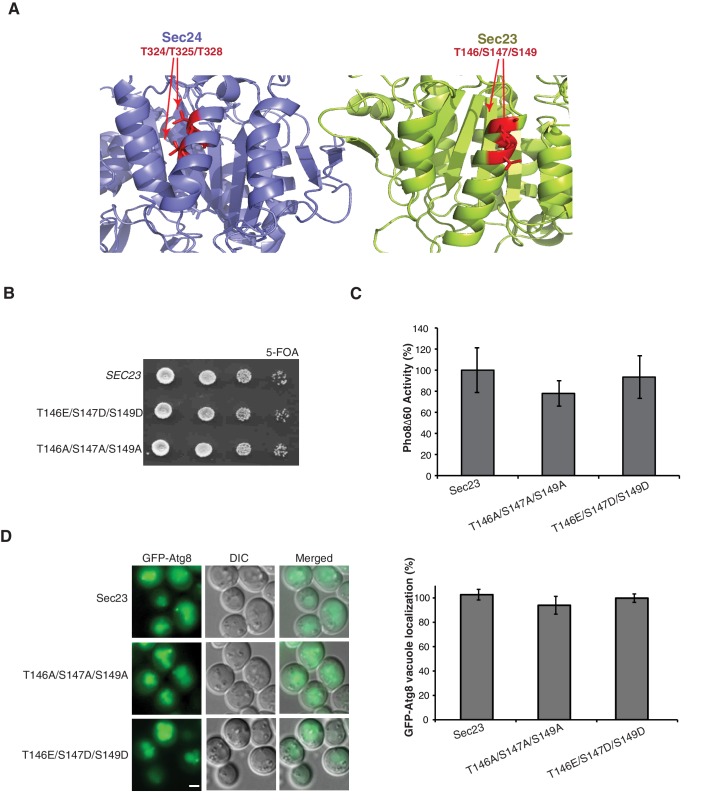
Figure 2—figure supplement 2. Phosphorylation of the Sec23 membrane distal sites is not required for autophagy.

Figure 2—figure supplement 2.

(A) Ribbon diagram of Sec23 (lime) and Sec24 (lavender) with membrane distal phosphorylation sites highlighted (red). (B) Plasmids encoding SEC23 (WT) or mutant sec23 were expressed in SFNY1948 and grown on 5-FOA at 25°C for 2–3 days to select against the WT plasmid. (C) Vacuolar phosphatase activity was measured in protein extracts of cells expressing WT Sec23 and mutant Sec23-T146A/T147A/S149A or Sec23-T146E/S147D/S149D. The activity of WT 2 hr after starvation was set as 100% and time 0 was subtracted. Averages and s.e.m are shown for three biological replicates, p-values=0.48 (T146A/T147A/S149A), 0.6 (T146E/S147D/S149D). (D) Translocation of GFP-Atg8 to the vacuole was examined in WT and the sec23 mutants 1 hr after nitrogen starvation at 25°C (left). Scale bar 2 µm. 300 cells were quantitated (right). WT was set to 100% for each experiment and had an average of 75% vacuolar localization. Averages and s.e.m are shown for three biological replicates, p-values=0.34 (T146A/T147A/S149A), 0.74 (T146E/S147D/S149D).