. 2016 Nov 18;5:e21167. doi: 10.7554/eLife.21167

Figure 5. Phosphorylation of the Sec24 membrane distal sites regulates the Sec24-Atg9 interaction.

(A) GST-Atg9C (200 nM) was incubated with 37.5 nM of WT Sec23/Sec24-His6, Sec23/Sec24-T325E-His6 or Sec23/Sec24-T324E/T328E-His6 (left). Ratio of Sec24 bound to GST-Atg9C was quantified from three biological replicates. Averages and s.e.m. are shown (right). WT Sec23/Sec24 was set as one for each experiment; p-value = 0.018 (T325E), 0.0008 (T324E/T328E), Student’s unpaired t-test. (B) Sec24 (WT) and Sec24-T324A/T325A or (C) Sec24-T324A/T325A/T328A (Sec24-3A) were immunoprecipitated from lysates expressing Atg9-13myc as described in the Materials and Methods. Precipitated Atg9-13myc was quantitated and normalized to the amount of Sec24 in the precipitate. WT Sec24 was set as one for each experiment. Averages and s.e.m. are shown for 4 (B) or 5 (C) biological replicates; p-value = 0.006 (B), 0.0008 (C) Student’s unpaired t-test. (D) Alignment of the region surrounding T324/T325/T328 (shown in red) with Sec24 orthologues. (E) Same as (B) except Sec24 was immunoprecipitated from WT or hrr25-5 lysates. Averages and s.e.m. are shown for five biological replicates. p-value = 0.0002, Student’s unpaired t-test. **p<0.01; ***p<0.01; ***p<0.001.

DOI: http://dx.doi.org/10.7554/eLife.21167.013

Figure 5.

Figure 5—figure supplement 1. GST negative control for in vitro binding in Figure 5A.

Figure 5—figure supplement 1.

(A) Equimolar amounts of GST or GST-Atg9C (200 nM) were incubated with 37.5 nM of WT Sec23/Sec24-His6, Sec23/Sec24-T325E-His6 or Sec23/Sec24-T324E/T328E-His6. (B) Sec24 T324E/T325E does not disrupt the Sec24-Atg9 interaction in vivo. Sec24 T324E/T325E was immunoprecipitated from lysates expressing Atg9-13myc as described in the Materials and Methods (left). Precipitated Atg9-13myc was quantitated and normalized to the amount of Sec24 in the precipitate (right). Precipitated WT Sec24 was set as one for each experiment. Averages and s.e.m. are shown for five biological replicates; p-value = 0.39, Student’s unpaired t-test.
Figure 5—figure supplement 2. Sec24-3A does not affect Atg assembly at the PAS.

Figure 5—figure supplement 2.

(A) Sec24 and Sec24-3A cells expressing Ape1-RFP and GFP tagged Atgs were treated with 400 ng/mL rapamycin for 1 hr at 25°C and the percent of Ape1-RFP colocalized with Atgs was determined in 300 cells. Arrowheads point to Ape1 puncta that colocalize with the Atg. Scale bar 2 µm. (B) The six Atg hierarchy groups are the Atg1 complex; the phosphatidylinositol 3-phosphate kinase complex (PI3K); the Atg2/Atg18 complex; the transmembrane protein Atg9; and two different ubiquitin-like conjugating systems, Atg12/Atg5/Atg16 and Atg8-PE. Asterisks denote Atgs that were examined. (C) Quantitation of data in (A). Averages and s.e.m. are shown for three biological replicates; p-value = 0.78 (Atg2), 0.38 (Atg5), 0.75 (Atg9), 0.7, (Atg13) 0.69 (Atg14), Student’s unpaired t-test.
Figure 5—figure supplement 3. Sec24-3A does not affect ERES formation.

Figure 5—figure supplement 3.

(A) Cells with Sec13-GFP and expressing either Sec24 or Sec24-3A were grown in nutrient rich medium (SMD) or starved for nitrogen (SD-N) for 2 hr at 25°C. Scale bar 2 µm. (B) The number of Sec13-GFP puncta per cell was quantitated. Over 300 cells were quantitated from three biological replicates. Averages and s.e.m. are shown; p-value = 0.8 (SMD), 0.35 (SD-N).
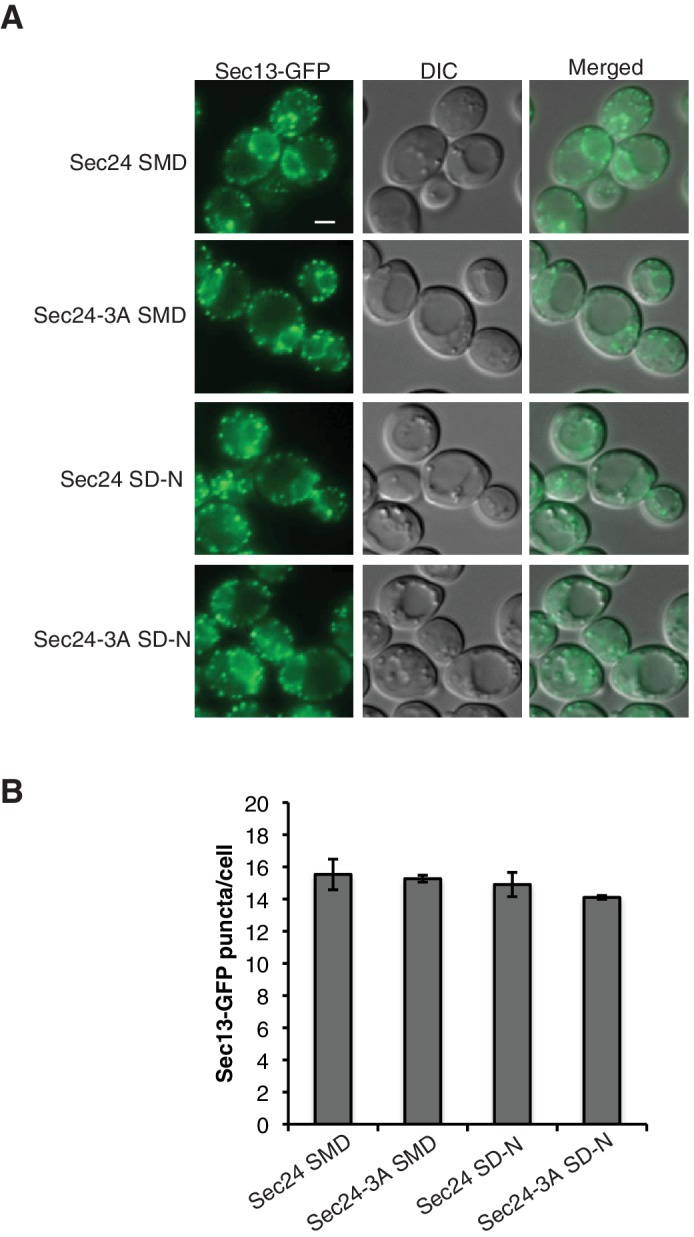
Figure 5—figure supplement 4. Representative blots for quantitation shown in Figure 5E.

Figure 5—figure supplement 4.

Sec24 was immunoprecipitated from lysates prepared from WT and hrr25-5 cells expressing Atg9-13myc. Cropped western blot (top). Uncropped western blot (bottom) from top showing pre-immune controls (left boxed area) for samples in lanes 5 and 6 (right boxed area).
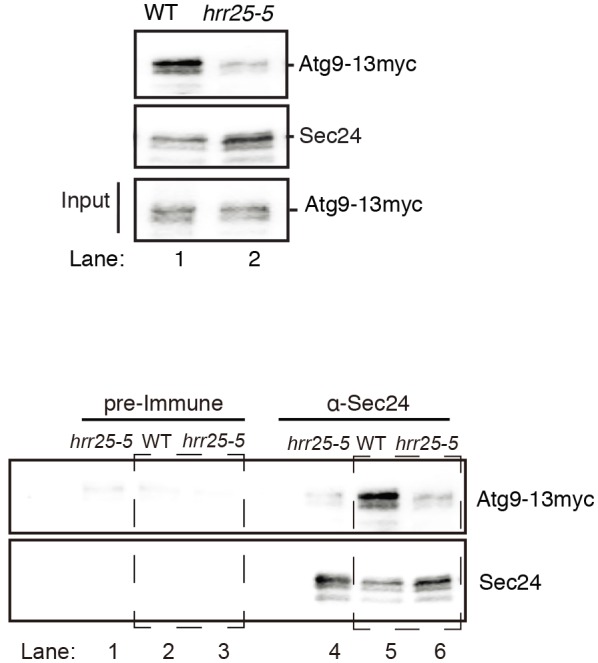
Figure 5—figure supplement 5. Autophagic body number is reduced in the hrr25-5 mutant.

Figure 5—figure supplement 5.

(A) Representative images of autophagic bodies in pep4Δ (left) or hrr25-5pep4Δ (right) cells 1.5 hr after nitrogen starvation at 37°C. Scale bar represents 500 nm. (B) Histogram showing the distribution of the number of autophagic bodies per cell section in WT and the hrr25-5 mutant. The number of autophagic bodies was quantitated for 100 cell sections for each strain (left). p-value = 0.0016; Mann-Whitney Test. Box plot of the number of autophagic bodies per cell section. Bars show data between the lower and upper quartiles, the median is a horizontal line within the box. Whiskers indicate the smallest and largest observations (right). (C) The diameter of autophagic bodies was determined. For WT N = 396, for hrr25-5 N = 254. Averages with error bars as s.e.m. are shown.