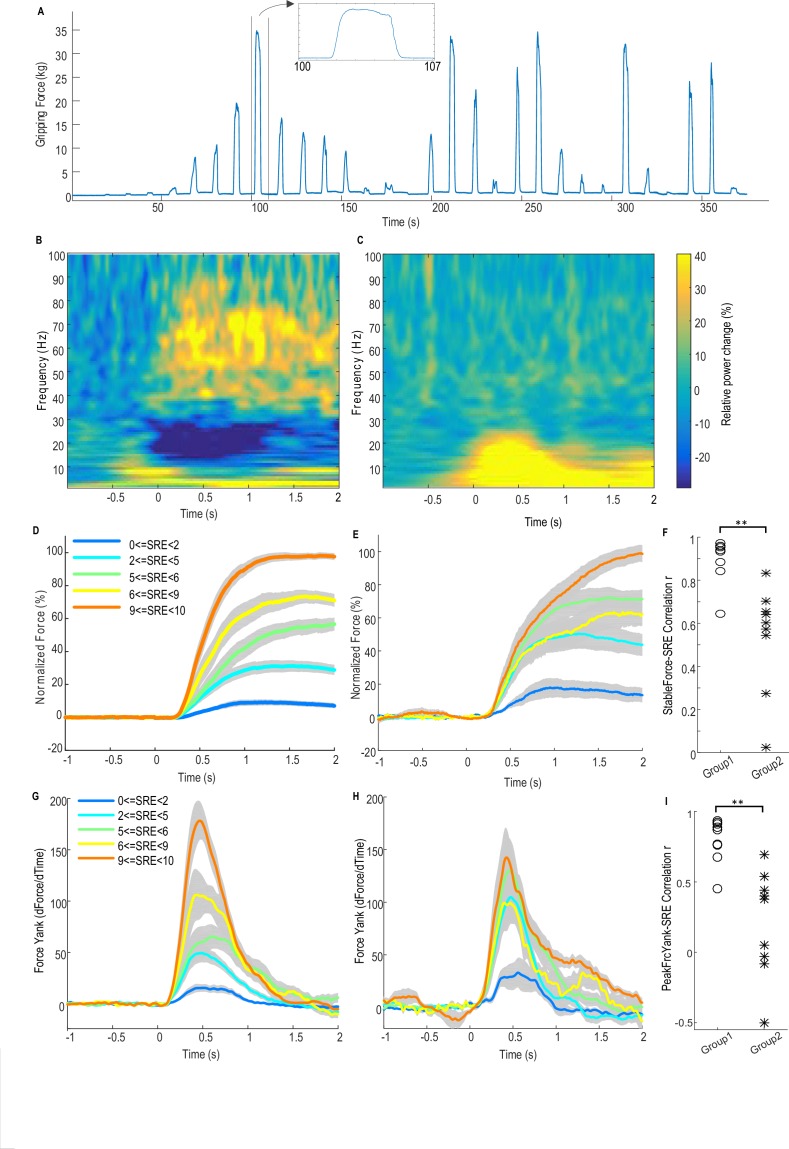
Figure 1. Force-effort scaling and spectra of average power changes relative to pre-movement baseline for two groups of electrodes.
(A) Trajectory of measured force from one exemplar subject. (B) From one group of electrodes (n = 9), a significant reduction of power in the beta band (13–30 Hz) and increase in power in the broad gamma band (55–90 Hz) was observed during gripping. (C) In another group of electrodes (n = 9), significant simultaneous modulation was absent in the beta and gamma band with movement, and there was instead an increased power across the low frequency band during gripping. Trajectories of force (D) and force yank (G) for Group one show that the stable force during the holding phase (1–2 s after cue) as well as the peak force yank in the force initialisation phase scaled well with self-rated effort (SRE). In group 2, the stable force (E) and force yank (H) did not scale with effort as well as Group 1. Group two had significantly lower correlation coefficients between stable force and SRE (F) and between the peak force yank and SRE (I) compared with group 1 (p<0.0001), indicating some impairment in the scaling of force with effort. Time 0 indicates the onset of the cue to start a grip in B–E, G and H. Note that data from three electrodes are excluded. Of these, two had significant modulation in the beta band but not in the gamma band, and one had significant modulation in the gamma band, but not in the beta band.
DOI: http://dx.doi.org/10.7554/eLife.19089.003

