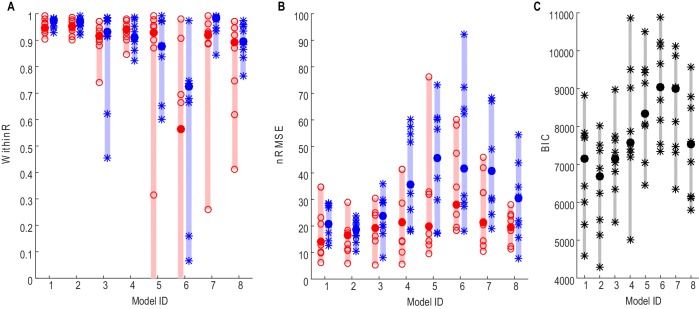
Figure 2. Force prediction performances of different models evaluated in terms of within-trial correlation (A), RMSE (B) and BIC (C).
The filled dots and shaded bars show the median and range across all STNs; the open circles and stars show the data for each individual STN. The red dots and bars show performance in predicting high effort forces, while using data from low effort trials for model fitting; the blue dots and bars show performance in predicting low effort forces, while using data from high effort trials for model fitting. (C) The total BIC values combing the force predictions for low effort and high effort for all tested models. The filled dots and shaded bars show the median and range across all STNs; the stars show the data for each individual STN (some overlap). Models 1–3 use beta and gamma ERS as model inputs; Models 4–5 use activities from all three frequency bands (alpha, beta and gamma) as model inputs; Models 6–8 use activities from a single frequency band (alpha, beta and gamma, respectively) as model inputs.
DOI: http://dx.doi.org/10.7554/eLife.19089.007

