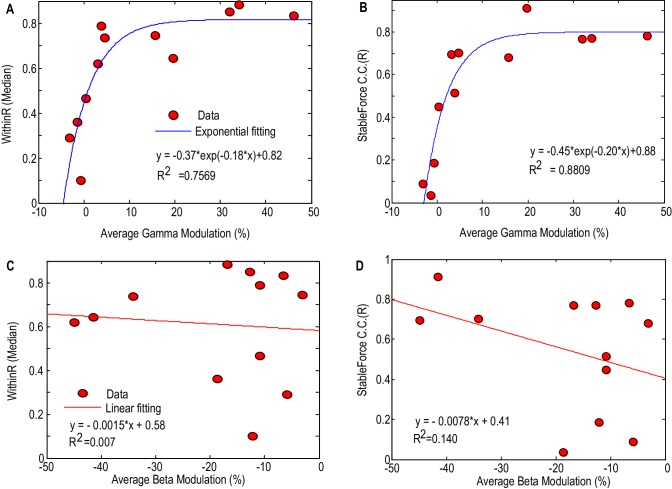
Figure 6. Factors affecting the gripping force prediction performance.
The median values of the WithinR (A) and stable force correlation coefficients (B) increased with the average movement- related modulation in the gamma band. Each dot is the data for one STN and the blue line shows the exponential fit of the data (, p<0.001 for the fitting). The median values of the WithinR (C) and stable force correlation coefficients (D) show a trend of increasing with average movement related desynchronization in the beta band. The blue lines show a linear fitting, but the fits were not significant. In this Figure, we consider all the STNr with significant movement-related modulations, whether either in one or other, or both frequency bands of interest (N = 12).

