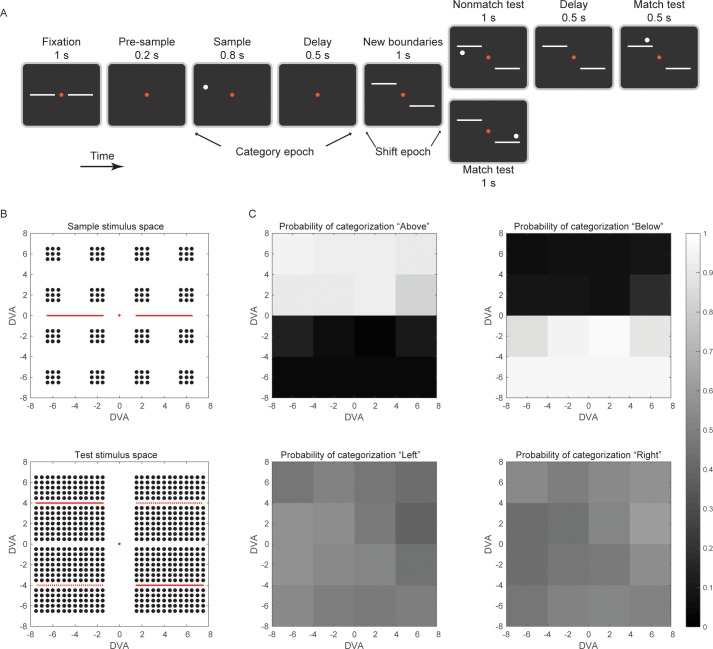
Figure 1. The task design.
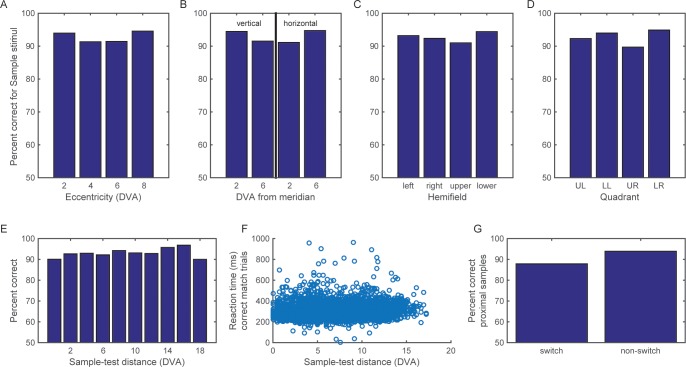
(A) The trial started when the animal held a bar and maintained visual fixation on the red central dot for 1 s. During fixation, in order to help the animal re-calibrate the Above/Below categorization boundary after the last trial, the 2 hemi-boundaries were also displayed. The sample stimulus appeared either above or below the horizontal meridian. To reduce the possibility of perceptual binding between the sample stimulus and the horizontal boundaries, there was a brief, 200 ms time gap between the two displays (pre-sample epoch). After the post-sample delay epoch, 2 hemi-boundaries were displayed at new locations, according to a CW (as shown) or CCW shift. The animal had to adjust the decision criterion based on the location of the new boundaries. When a test stimulus appeared, it had to be compared to the sample stimulus in a boundary-referenced, rather than a retinotopic, spatial frame. If a non-match, the first test would be followed by a second test, always a match to the sample category. Until display of a match test, the animal had to maintain visual fixation and contact with the bar. Upon a match test display, the animal had to release the bar for liquid reward. (B) Sample stimuli could appear randomly at any one of the 144 locations shown (top), with equal probability in the category Above or Below (DVA: degrees of visual angle). Test stimuli (equal probability for categories above and below the new boundaries) could appear at any one of the 624 locations shown (bottom). The continuous red horizontal lines in the test space indicate the position of hemi-boundaries after CW shift, and the dashed lines (dashed only for illustration) indicate the CCW shift. Each trial would test one of 89,856 possible sample-test combinations, equally distributed between match and non-match types. After the boundary shift, the Above/Below categories spanned a visual area that overlapped with the corresponding area of the pre-shift categories by 50%. (C) The probability to categorize a sample stimulus as ‘Above', 'Below', 'Left’, or 'Right’, by spatial location. The animals would choose Left or Right with equal probability, because the Left/Right dimension was task-irrelevant. See also Figure 1—figure supplement 1.


