. 2016 Nov 14;5:e17822. doi: 10.7554/eLife.17822

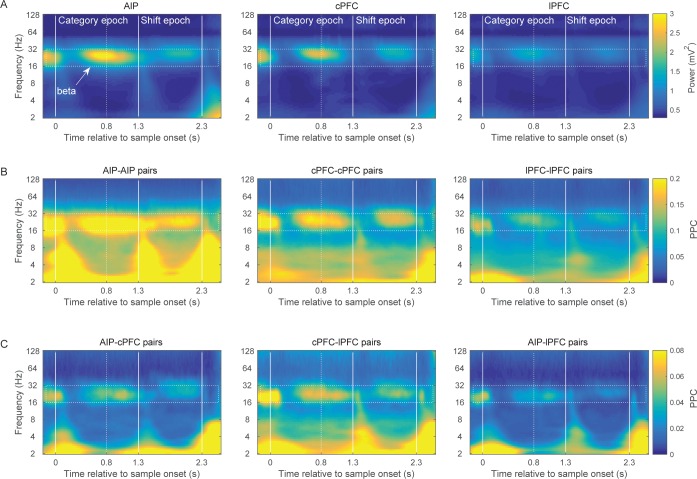
Figure 2. Brain rhythms of the frontoparietal network.

(A) Average power (mV2) of the LFPs recorded from AIP (left), cPFC (middle), and lPFC (right) electrodes in time-frequency space. Strong oscillations are seen at the beta band (16–32 Hz; dotted rectangle in all panels) in all three areas. For these analyses, the evoked component has been removed from the LFPs, and the power has been normalized to 1/f. Spectral analyses were performed at six octaves (2–128 Hz), at a 0.1 octave resolution (i.e., 10 frequency bins per octave). Vertical white lines demarcate the Category and Shift epochs, and dashed white lines indicate the end of sample display. (B) Strong synchrony (Pairwise Phase Consistency) of beta-band oscillations (16–32 Hz) is observed across pairs of electrodes within AIP (left), cPFC (middle) and lPFC (right). (C) As also seen with power (A) and intrinsic synchrony in the three areas (B), strong synchrony of beta-band rhythms is also seen in the extrinsic pairs of electrodes across the three areas: AIP-cPFC (left), cPFC-lPFC (middle), and AIP-lPFC (right). Recording sites appear in Figure 2—figure supplement 1. The corresponding figure before removal of the evoked component appears in Figure 2—figure supplement 3 and the cross-area synchrony for match vs. non-match trials appears in Figure 2—figure supplement 2.

DOI: http://dx.doi.org/10.7554/eLife.17822.005

Figure 2.

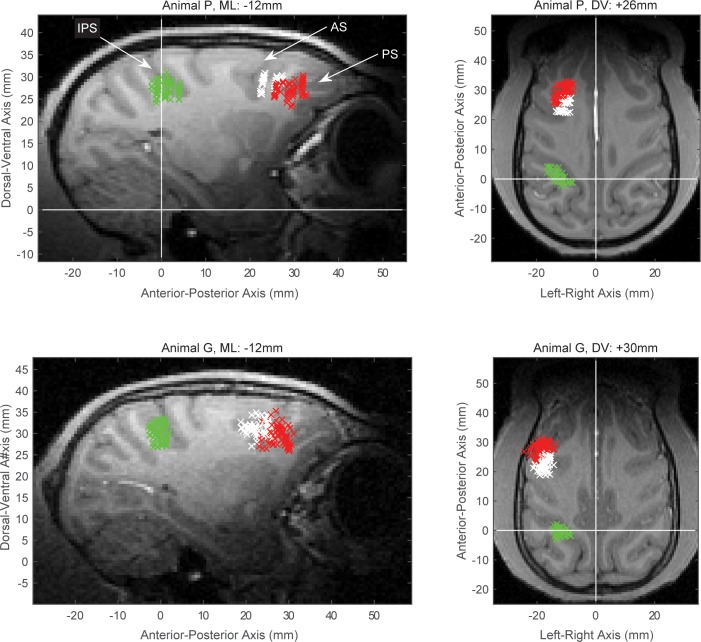
Figure 2—figure supplement 1. Electrophysiological recording sites.

Figure 2—figure supplement 1.

The MRI-guided recording sites, projected to a single sagittal (left) and a single horizontal (right) slice from animal P (top) and animal G (bottom). The intraparietal sulcus (IPS), arcuate sulcus (AS) and principal sulcus (PS) are indicated on the top left panel. The data from posterior parietal recordings came from the anterior intraparietal area, located on the rostral lateral bank of IPS (area AIP, green marks). Data from prefrontal recordings were distinguished between the sites around the AS (area 8A, white marks), which we label as caudal PFC (cPFC) in the text, and the area around the PS (red marks), which included areas 46 and 45 and we label as lateral PFC (lPFC) in the text.
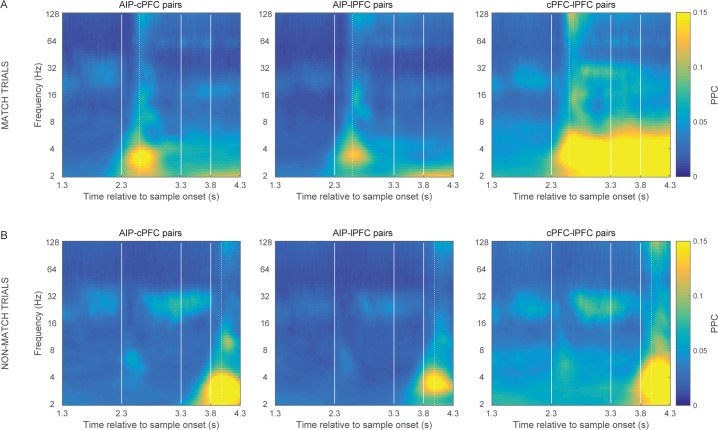
Figure 2—figure supplement 2. Match vs.non-match trials.

Figure 2—figure supplement 2.

Frontoparietal synchrony following the Shift epoch separately for match (A) and non-match trials (B). Strong synchrony of low frequency rhythms was observed upon presentation of the test stimulus that matched the sample category (at 2.3 s following sample onset for match trials and at 3.8 s for non-match trials). This effect may be related to the bar-release motor movement, the oculomotor movement that typically follows the release from required visual fixation, or the reward. Vertical lines demarcate the onset of the test stimulus display (2.3 s), the delay interval following (at 3.3 s), and the onset of the second test at non-match trials (3.8 s). Dotted vertical lines mark the average reaction time in match (299.06 ms) and non-match trials (181.86 ms), relative to the display onset of the corresponding match test stimulus.
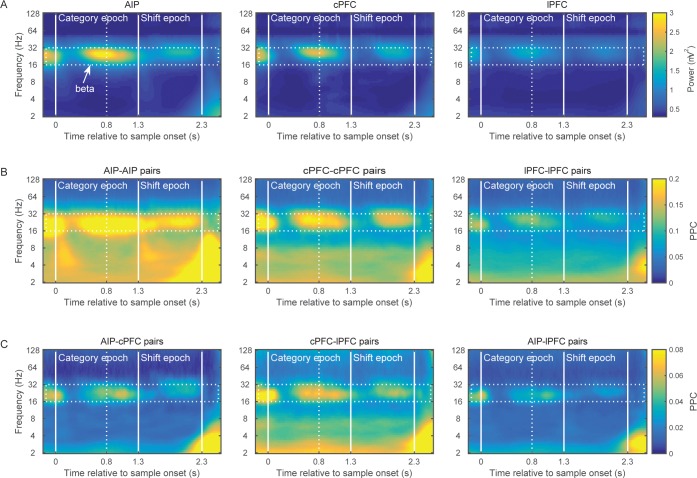
Figure 2—figure supplement 3. Power and synchrony of LFPs before removal of the evoked component.

Figure 2—figure supplement 3.

The results are very similar to those of Figure 2, except for some stimulus-locked effects at low frequencies.