. 2016 Nov 14;5:e17822. doi: 10.7554/eLife.17822

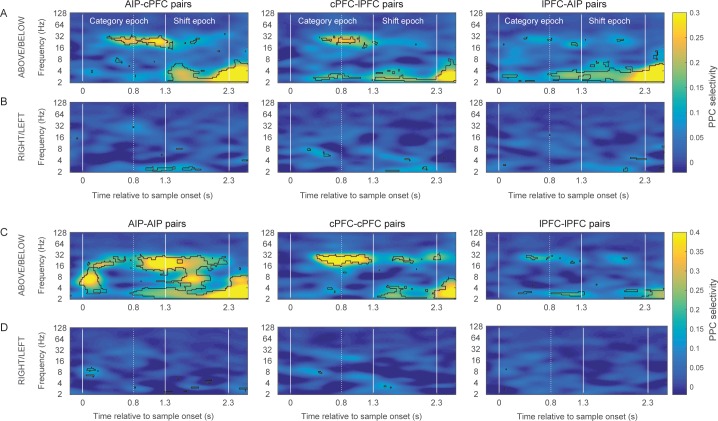
Figure 4. Category-selective synchrony of frontoparietal rhythms.

(A) and (B) Population average of PPC selectivity of all simultaneously recorded pairs of AIP and cPFC (left), cPFC and lPFC (middle), lPFC and AIP (right) electrodes along the task-relevant, Above/Below, dimension (A) and task-irrelevant, Right/Left, dimension (B). (C) and (D) PPC selectivity of intrinsic pairs of electrodes within AIP (left), cPFC (middle) and lPFC (right) along the Above/Below (C) and Right/Left (D) dimensions. In all panels, contours identify regions of time-frequency space with statistically significant population selectivity. Similar time-frequency dependent patterns were seen in the percent of sites with significantly selective synchrony (see Figure 4—figure supplement 1). The time-frequency dynamics of PPC were similar for both the Above and Below categories (see Figure 4—figure supplement 2).

DOI: http://dx.doi.org/10.7554/eLife.17822.010

Figure 4.

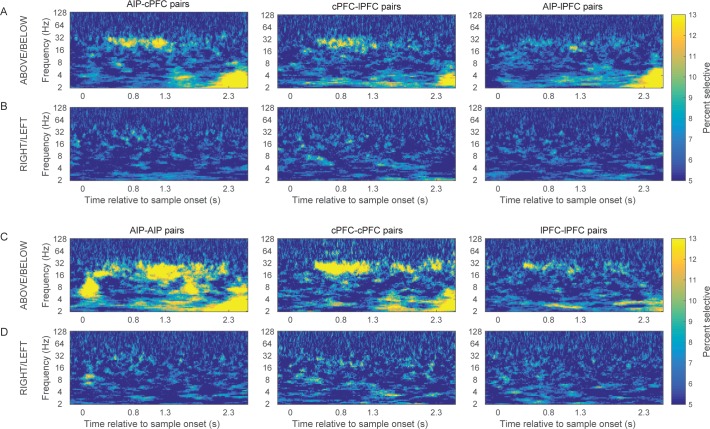
Figure 4—figure supplement 1. Prevalence of category-selective synchrony of frontoparietal rhythms.

Figure 4—figure supplement 1.

Same as Figure 4, but for the percent of pairs of electrodes with statistically significant category selectivity in PPC.
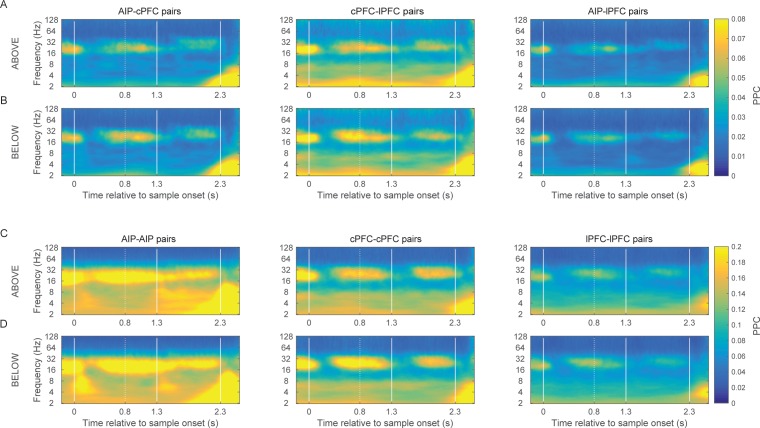
Figure 4—figure supplement 2. Category-specific synchrony of oscillations in the frontoparietal network.

Figure 4—figure supplement 2.

The time-frequency dynamics of synchrony are very similar for both the Above and the Below categories in the between-area pairs of electrodes (A and B) as well as the within-area pairs of electrodes (C and D).
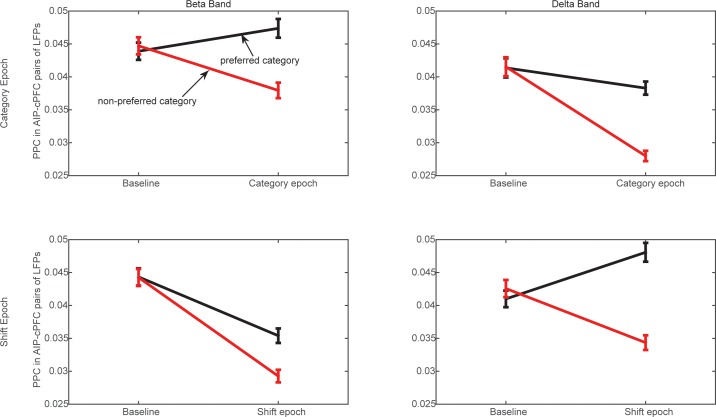
Figure 4—figure supplement 3. Frontoparietal synchrony for preferred/non-preferred categories vs. pre-trial baseline.

Figure 4—figure supplement 3.

Average PPC between AIP and cPFC electrodes in the beta band (left) and the delta band (right) during the Category epoch (top) and the Shift epoch (bottom), during the pre-trial baseline and the corresponding trial epoch. Black lines correspond to trials of the preferred category (Above or Below), and red lines correspond to trials of the non-preferred category. Each comparison to baseline was statistically significant (p<0.001; 2-tailed t-test for paired samples).