. 2016 Nov 14;5:e17822. doi: 10.7554/eLife.17822

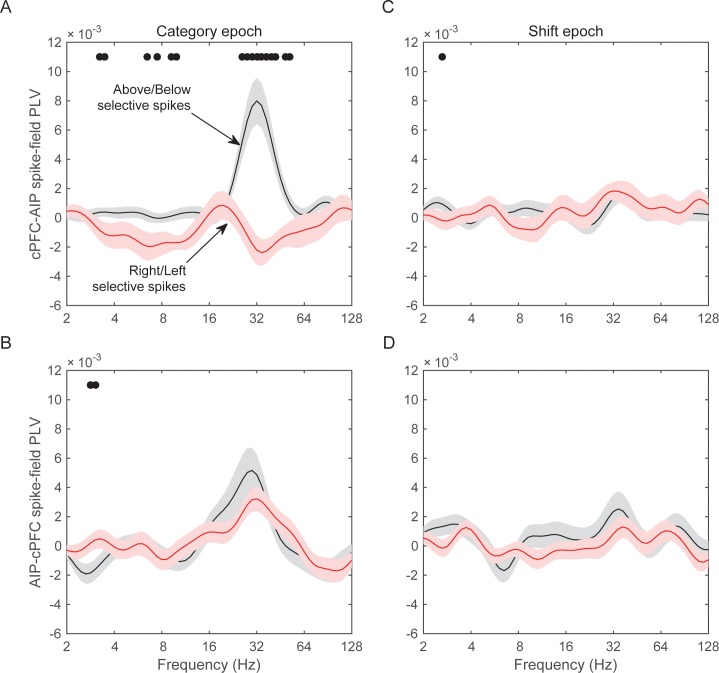
Figure 8. Spike-LFP synchrony for selective spiking.

(A) Average (± SEM) PLV between cPFC spikes and AIP LFPs as a function of frequency, separately for electrodes with strong Above/Below selectivity in their spiking (black trace) and electrodes with strong Right/Left selectivity in their spiking (red trace) during the Category epoch of the categorization trials. Dots mark frequencies of significant difference between the red and black traces (2-tailed t-test; p<0.05). (B) Same as (A), but in reverse direction: synchrony between AIP spikes and cPFC LFPs. (C) and (D) Same as (A) and (B) respectively, but for the Shift epoch of the categorization trials. The group statistics of the electrodes used in these analyses (electrodes at the top 10% of spiking selectivity) appear in Table 1. See also Figure 8—figure supplement 3 for the corresponding analyses on the other combinations of spike-LFPs. See Figure 8—figure supplement 2 for a comparison of spikes with vs. without Above/Below selectivity. Figure 8—figure supplement 1 illustrates cPFC-AIP spike-LFP synchrony separately for each category.

DOI: http://dx.doi.org/10.7554/eLife.17822.024

Figure 8.

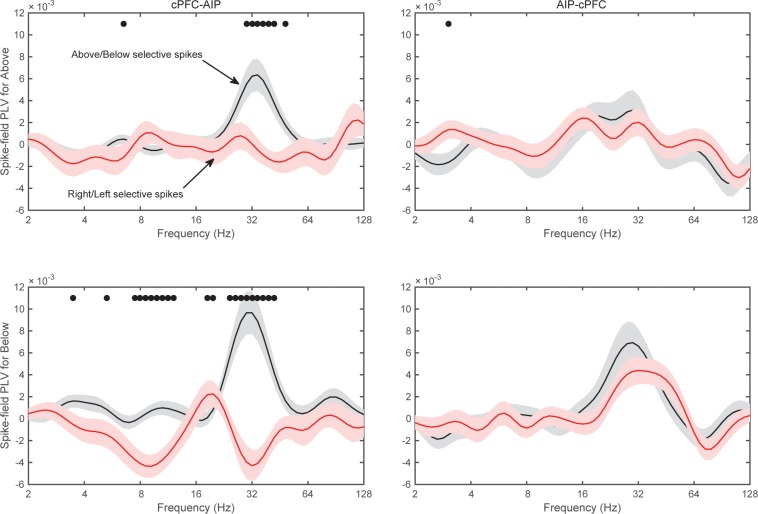
Figure 8—figure supplement 1. Spike-field synchrony of cPFC-AIP pairs separated by category.

Figure 8—figure supplement 1.

Top panels for PLV evaluated from trials of category Above and bottom panels for trials of category Below. Left for spikes from cPFC and LFPs from AIP, and right panels for the reverse. For each of the categories, the dynamics of spike-LFP synchrony are similar to those in Figure 8.
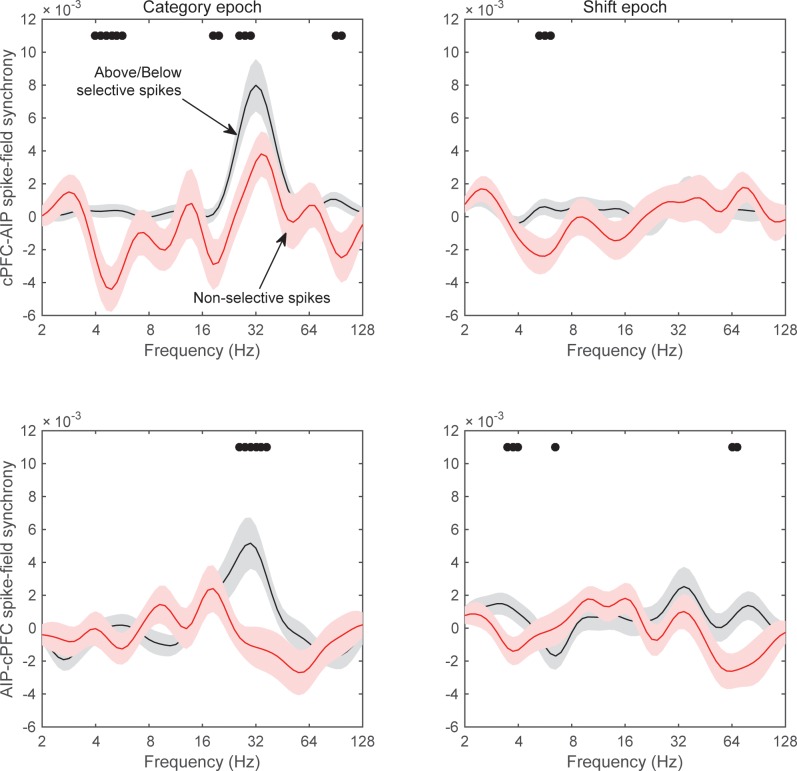
Figure 8—figure supplement 2. Spike-field synchrony for category-selective vs.non-selective spiking.

Figure 8—figure supplement 2.

As in Figure 8, ‘Above/Below selective spikes’ (black line) refers to electrodes with the top 10% of spiking selectivity for Above/Below categories. ‘Non-selective spikes’ (red line) refers to electrodes with the bottom 10% of spiking selectivity for Above/Below categories.
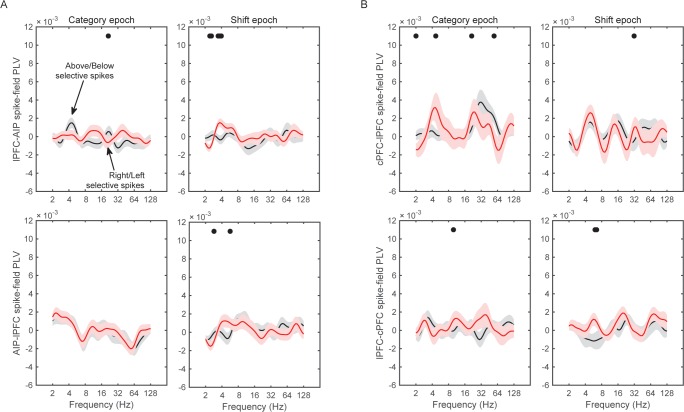
Figure 8—figure supplement 3. Spike-field synchrony for selective spikes.

Figure 8—figure supplement 3.

Same analyses as in Figure 8, but for spikes in lPFC and LFPs in AIP (top panels in A), spikes in cPFC and LFPs in lPFC (top panels in B), and the respective reverse directions (bottom panels in A and B).