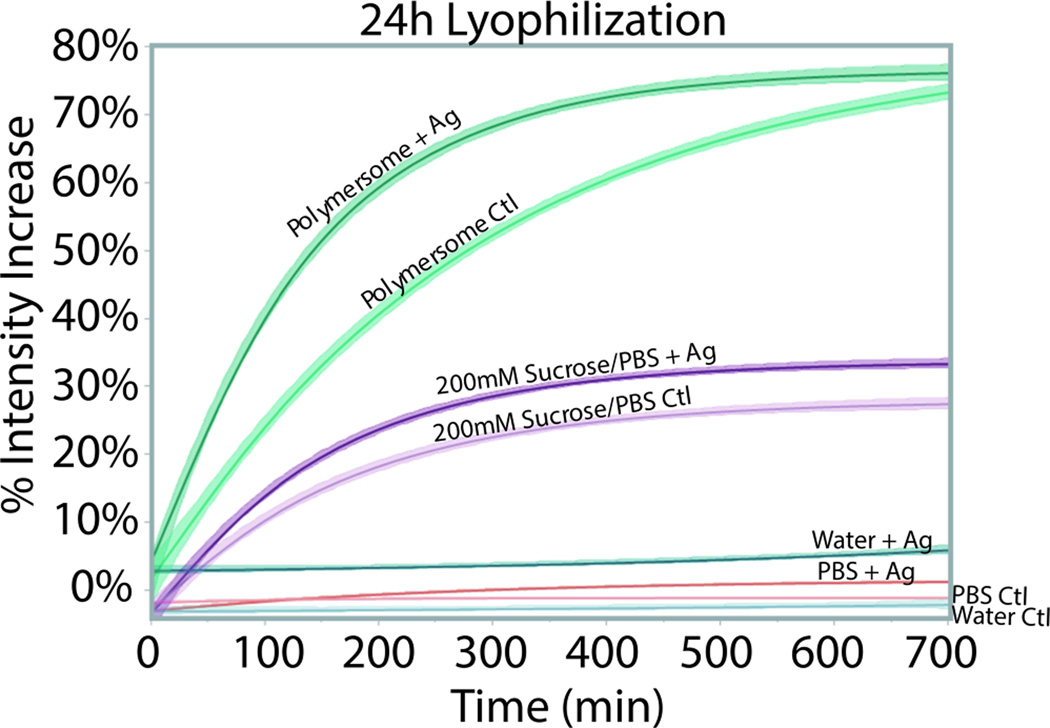
Figure 3.
Functional rates of 5-HT1AR in polymersomes (pGUPs) versus various solutions. Controls (Ctl), no agonist pGUPs, are plotted alongside agonist-exposed samples (+Ag). The percent intensity increase of the samples indicates the population of functional protein. In DI water and PBS, the 5-HT1AR displays no fluorescence activity. In 200 mM sucrose in PBS (pH 7.4) 5-HT1AR displays weaker fluorescence intensity increase compared to pGUPs. Furthermore there is no difference in rate between the Ctl and +Ag protein in 200 mM sucrose in PBS.

