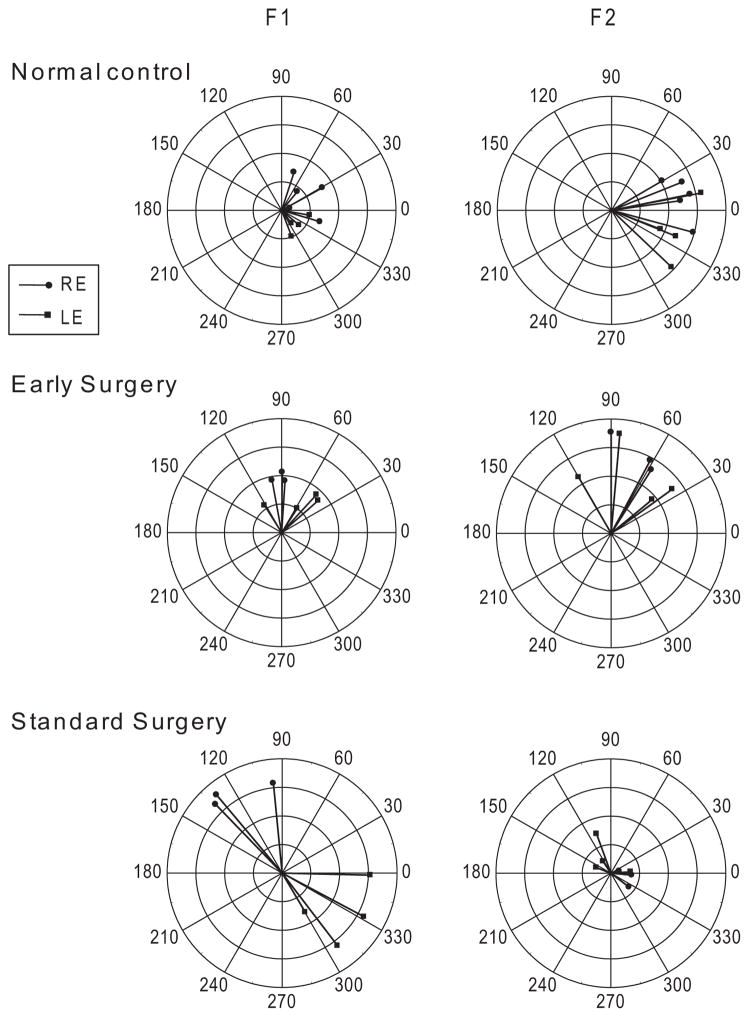
Figure 1.
Polar plots of mVEP amplitude (4 μV, full scale) and phase in normal control subjects (top) and in patients who underwent early surgery (middle) or standard surgery (bottom). Each vector is an individual response from a 10-second trial while viewing monocularly with the right or left eye. The length of the vector depicts amplitude (in micro-volts) and the direction indicates phase (0–360°). F1, first harmonic response; F2, second harmonic response. Control subject and patient with early surgery had smaller F1 but larger F2 responses, with the phases of the responses for the right and left eyes congregated in roughly the same direction. Patient with standard surgery had larger F1 but smaller F2 responses, with the phases of the response for the right and left eyes in opposite directions (approximately 180° out of phase).

