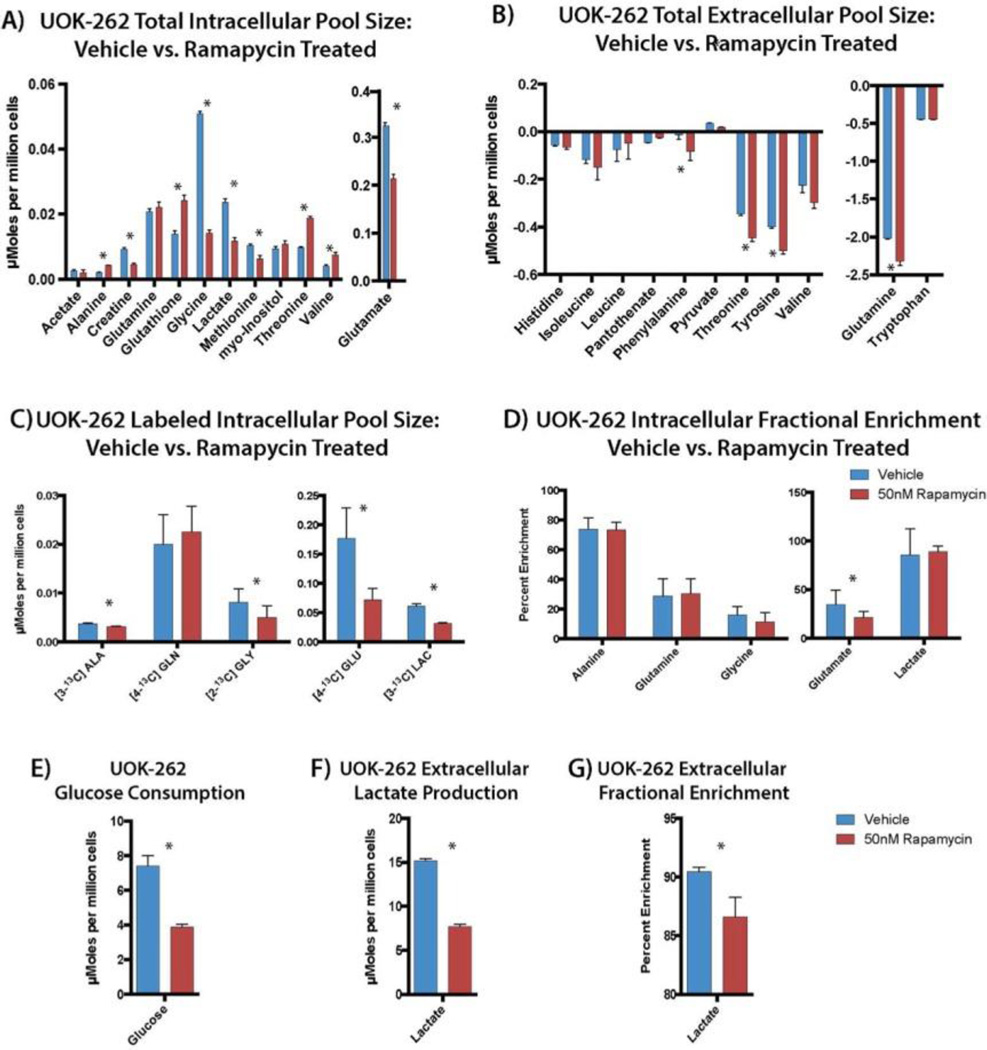
Figure 3.
(A) Metabolic profile of the total intracellular and (B) extracellular pool size of vehicle vs rapamycin treated UOK-262. (C) Labeled intracellular pool size and (D) fractional enrichment (FE) of relevant metabolites in vehicle and rapamycin-treated UOK-262 cells. (E) Glucose consumption, (F) labeled extracellular, and (G) FE of lactate production in UOK-262 in vehicle and rapamycin treated cells. Blue bar represents vehicle-treated cell and red bars represent rapamycin-treated cells. *P < 0.05.

