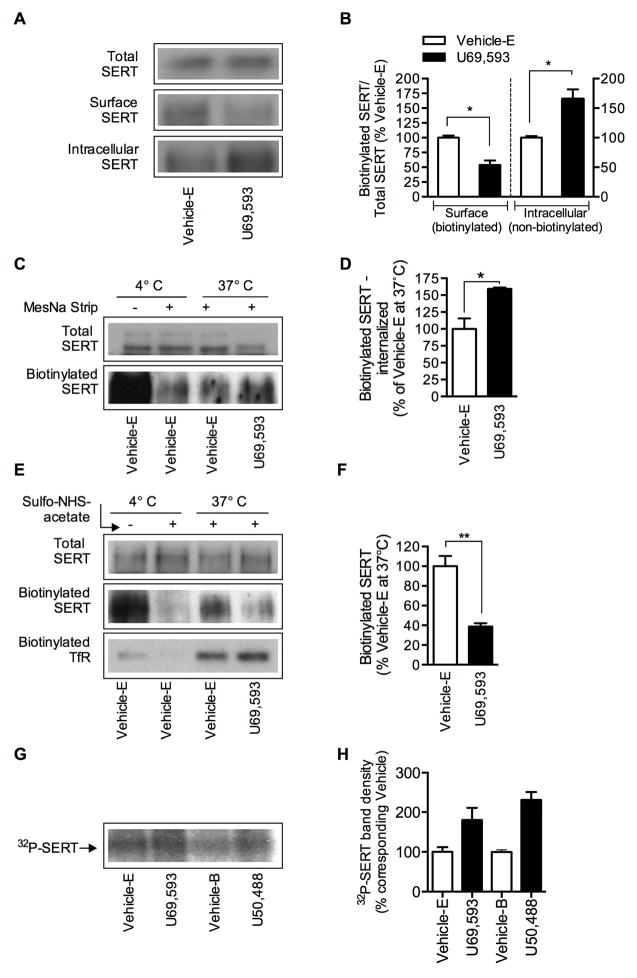
Figure 4. Effect of KOR activation on SERT trafficking and phosphorylation in EM4 cells.
EM4 cells coexpressing SERT and KOR were used to determine SERT surface expression, endocytosis and exocytosis of SERT protein and SERT phosphorylation as described under “Materials and Methods”. A to H, cells were treated with vehicle or U69,593 (10 μM) or U50,488 (10 μM) for 15 min at 37°C. The effect of U69,593 was compared with Vehicle-E containing 0.1% ethanol and the effect of U50,488 was compared with Vehicle-B containing KRH buffer. A, B. SERT surface expression: A, representative SERT immunoblots show total, biotinylated (surface) and non-biotinylated (intracellular) SERT (~96 kDa). B, the relative band densities of biotinylated SERT and non-biotinylated SERT that was normalized with total SERT from four separate experiments are presented as mean ± S.E.M. *p <0.05 U69,593 versus Vehicle-E. C, D. SERT internalization/endocytosis: C, a representative immunoblot shows the total biotinylated (lane 1, with out MesNa strip) and internalized-biotin-tagged SERT in Vehicle-E treated cells at 4°C and 37°C, and U69,593 treated cells at 37°C following MesNa treatment. D, SERT band densities of internalized/biotinylated SERT (mean ± S.E.M.) are given. *p <0.05 U69,593 versus Vehicle-E (Student’s t test, N=3). In parallel experiments, cells treated with Vehicle-E were kept at 4°C and total surface biotinylated SERT (without MesNa) and after MesNa treatment (background) were determined to examine the effectiveness of MesNa to remove biotin from biotinylated surface proteins. Note that under nonpermissive endocytosis conditions (4°C) after MesNa treatment, only less than ~5–10% biotinylated SERT (background) was evident from total amount of biotinylated SERT at 4°C (C: first two lanes) E, F. SERT plasma membrane insertion (exocytosis): E, a representative immunoblot shows total SERT, the newly inserted or plasma membrane surface delivered-biotin-tagged SERT and transferrin (TfR). F, the bar graph shows the densities of newly inserted plasma membrane SERT from three experiments (Mean ± S.E.M.). **p <0,01 U69,593 versus Vehicle-E (Student’s t test, N=3). In parallel experiments, cells treated with Vehicle-E were kept at trafficking nonpermissive condition (4°C) and total biotinylated SERT (without sulfo-NHS-acetate treatment) and after sulfo-NHS-acetate treatment (background) were performed to determine the effectiveness of sulfo-NHS-acetate to block all biotinylatable free amino groups. Note that under trafficking nonpermissive condition (4°C) after sulfo-NHS-acetate treatment, only less than ~5 biotinylated SERT (background) was evident from total amount of biotinylated SERT at 4°C (E: first two lanes). G, H. SERT phosphorylation: G, a representative autoradiogram shows 32P-labelled SERT band (~96 kDa) in Vehicle-E, U69,593 and U50,488 treated cells. H, the bar graph shows the relative 32P-labelled SERT band intensity (N=2).

