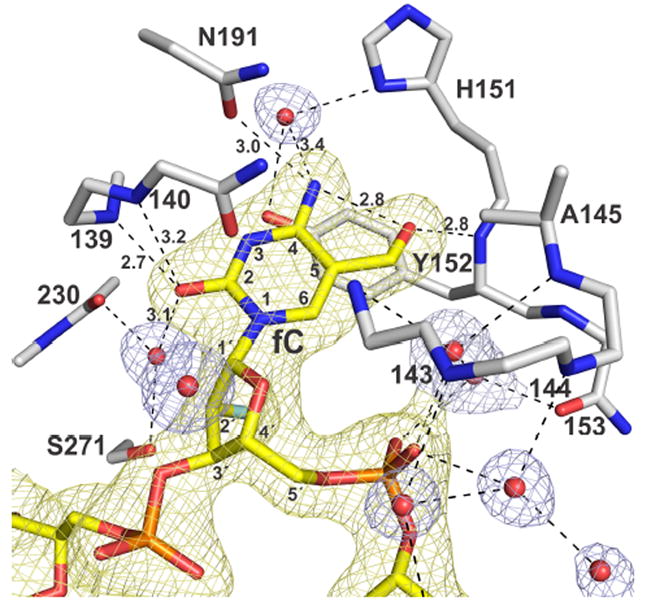
Figure 2.

Structure of TDG82-308 bound to G·fC DNA (PDB ID: 5T2W). TDG residues are white (N blue, O red), the dfCF-containing DNA is yellow (2′-F is cyan), and water molecules are red spheres. A 2Fo-Fc electron density map, contoured at 1.0 σ, is shown for DNA (yellow) and water molecules (blue) but not the enzyme (for clarity). Dashed lines are hydrogen bonds, with interatomic distances (Å) shown for contacts to fC (all others are ≤3.5 Å).
