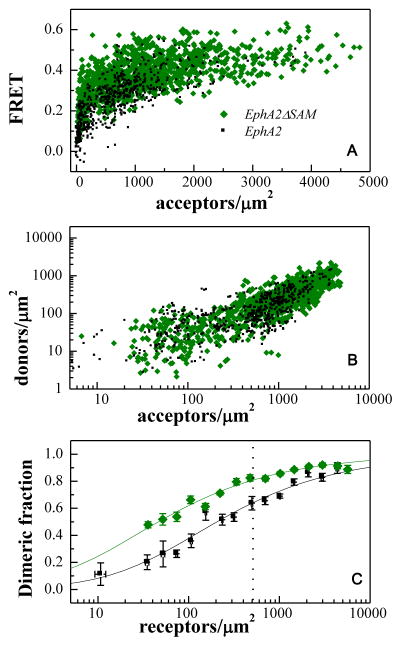
Figure 4.
FRET characterization of EphA2ΔSAM and EphA2 dimerization. (A) FRET efficiencies measured for EphA2ΔSAM and EphA2, as a function of acceptor (EphA2ΔSAM-YFP or EphA2-YFP) concentration. Every data point represents a single membrane region such as the one shown in Figure 3. (B) Donor concentration versus acceptor concentration in each membrane region. (C) Comparison of dimeric fractions as a function of receptor concentrations, for EphA2ΔSAM and EphA2. The dimeric fractions measured for individual membrane regions are binned, and the averages and the standard errors are shown with the symbols. The solid lines are the theoretical curves for the best-fit dimerization model. The deletion of the SAM domain leads to dimer stabilization by 0.9 ± 0.3 kcal/mole. The dashed vertical line indicates 600 receptors/μm2, the reported EphA2 expression in A549 lung cancer cells (52). At this level of EphA2 expression, deletion of the SAM domain increases the fraction of dimeric receptor by 20%. The increase is more pronounced when EphA2 is expressed at lower levels.

