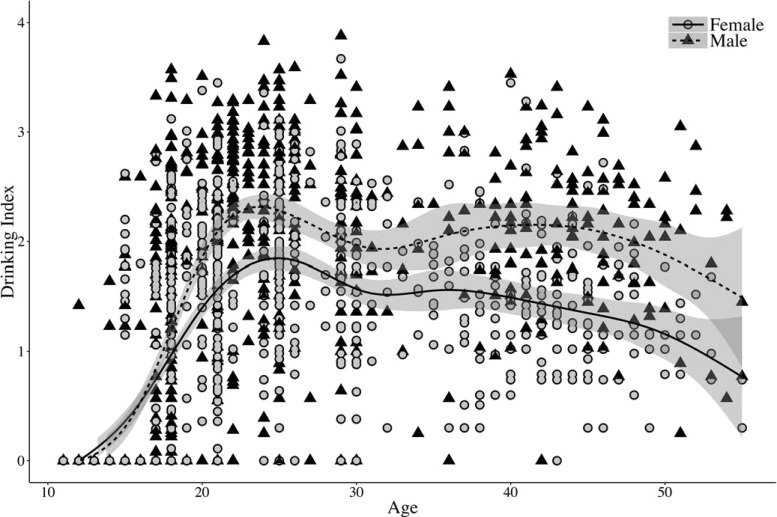
Figure 2.
Plot of drinking index by sex across all offspring and parent assessments. The plot shows only a random 10% of the full sample for clarity. Loess curves were added to graphically display the relationship between the drinking index and age by gender. Age 11 drinking index data were included for completeness but were not used in the analysis.

