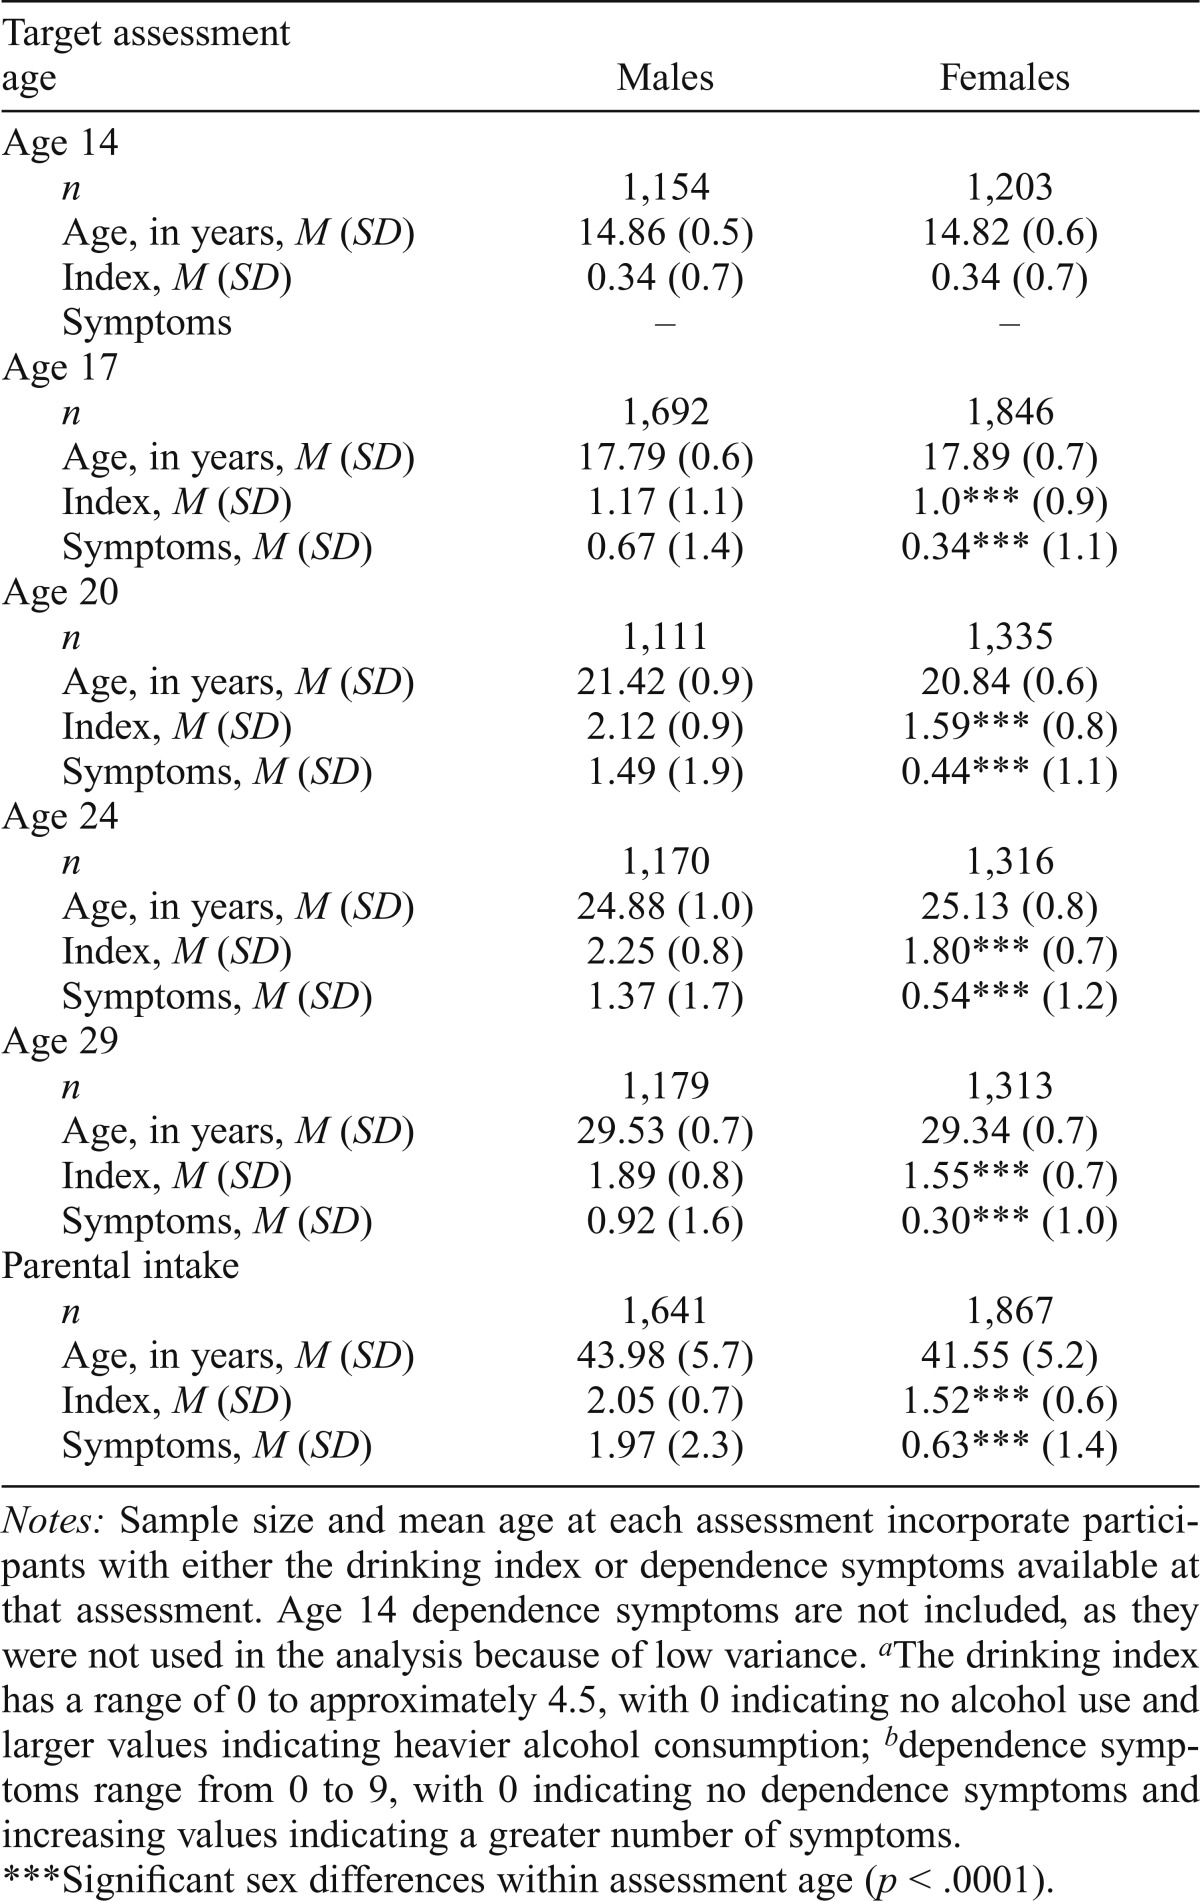
Table 1.
Descriptive information on age, drinking index,a and alcohol dependence symptomsb in offspring at all assessments and parents at twins’ first assessment
| Target assessment age | Males | Females |
| Age 14 | ||
| n | 1,154 | 1,203 |
| Age, in years, M (SD) | 14.86 (0.5) | 14.82 (0.6) |
| Index, M (SD) | 0.34 (0.7) | 0.34 (0.7) |
| Symptoms | – | – |
| Age 17 | ||
| n | 1,692 | 1,846 |
| Age, in years, M (SD) | 17.79 (0.6) | 17.89 (0.7) |
| Index, M (SD) | 1.17 (1.1) | 1.0*** (0.9) |
| Symptoms, M (SD) | 0.67 (1.4) | 0.34*** (1.1) |
| Age 20 | ||
| n | 1,111 | 1,335 |
| Age, in years, M (SD) | 21.42 (0.9) | 20.84 (0.6) |
| Index, M (SD) | 2.12 (0.9) | 1.59*** (0.8) |
| Symptoms, M (SD) | 1.49 (1.9) | 0.44*** (1.1) |
| Age 24 | ||
| n | 1,170 | 1,316 |
| Age, in years, M (SD) | 24.88 (1.0) | 25.13 (0.8) |
| Index, M (SD) | 2.25 (0.8) | 1.80*** (0.7) |
| Symptoms, M (SD) | 1.37 (1.7) | 0.54*** (1.2) |
| Age 29 | ||
| n | 1,179 | 1,313 |
| Age, in years, M (SD) | 29.53 (0.7) | 29.34 (0.7) |
| Index, M (SD) | 1.89 (0.8) | 1.55*** (0.7) |
| Symptoms, M (SD) | 0.92 (1.6) | 0.30*** (1.0) |
| Parental intake | ||
| n | 1,641 | 1,867 |
| Age, in years, M (SD) | 43.98 (5.7) | 41.55 (5.2) |
| Index, M (SD) | 2.05 (0.7) | 1.52*** (0.6) |
| Symptoms, M (SD) | 1.97 (2.3) | 0.63*** (1.4) |
Notes: Sample size and mean age at each assessment incorporate participants with either the drinking index or dependence symptoms available at that assessment. Age 14 dependence symptoms are not included, as they were not used in the analysis because of low variance.
The drinking index has a range of 0 to approximately 4.5, with 0 indicating no alcohol use and larger values indicating heavier alcohol consumption;
dependence symptoms range from 0 to 9, with 0 indicating no dependence symptoms and increasing values indicating a greater number of symptoms.
Significant sex differences within assessment age (p < .0001).

