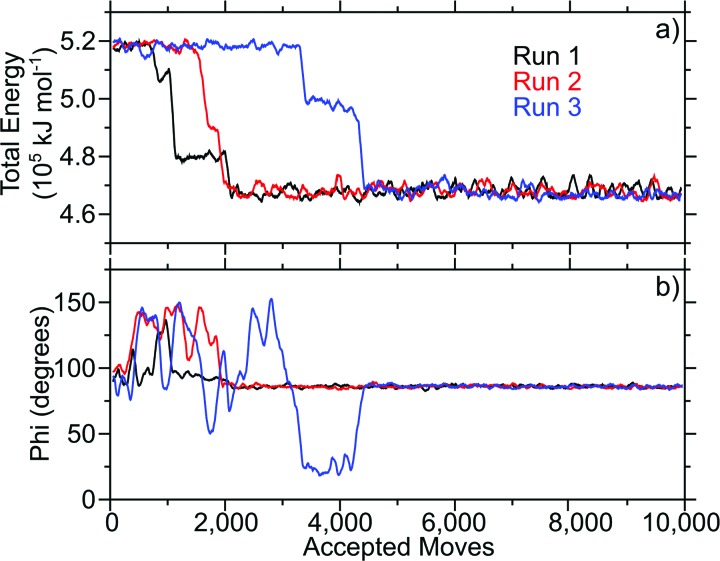
Fig. 2.
Total energy (a) and principal axis angle (b) of the LKα14 on graphene over the course of 10 000 accepted moves in three Monte Carlo simulations (shown in black, red, and blue). The simulations were started with the LKα14 peptide oriented such that the lysine residues were closest to the graphene surface. All plots show a 100-pt running average.

