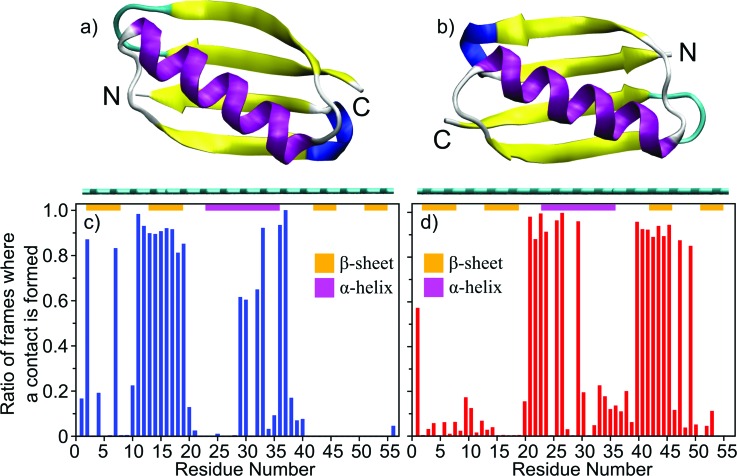
Fig. 3.
Predicted orientations of protein G B1 on a graphene surface through Monte Carlo simulations. The runs converged toward either the orientation represented in (a) or the orientation represented in (b). The graphene surface is colored in cyan and it is visible below the protein. The N- and C-termini of the protein are labeled. (c) and (d) Ratio of accepted Monte Carlo moves (referred to here as frames) where a particular residue is within 6 Å from the surface in the runs that converged either toward the orientation in (a) or in (b), respectively. The ratio is calculated with respect to the total number of sampled orientations where any atom of the protein is within 6 Å from the surface [prior to the calculation, the frames from all runs that converged toward either the orientation in (a) or in (b) were merged]. In the plots, the secondary structure regions are indicated with horizontal bars and colored in magenta for α-helices or orange for β-sheets, respectively.

